Intraday Process Dashboard
Contents
Analyze completed iWD tasks on an intraday basis.
Use the (CX Insights for iWD folder) > Intraday Process Dashboard to see an intraday overview of the completed iWD tasks that were overdue, along with the counts, percentages, and averages of completed iWD tasks, breaking down the average amount of time it took to complete tasks using three key metrics:
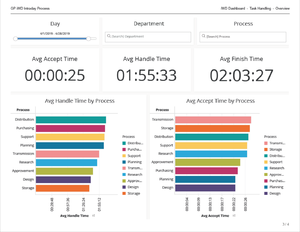
- Avg Finish Time — measuring the average time it took for tasks to be completed after entering the system,
- Avg Accept Time — measuring the average amount of time that tasks were backlogged before they reached a handling resource, and
- Avg Handle Time — measuring the average amount of time that resources worked on tasks.
The dashboard also provides an overview of the task backlog for a day or reporting interval, providing summary information about how many tasks are pending, how many tasks are overdue, and how many of the completed tasks were overdue. Data is organized by day, department, and business process.
Understanding the Intraday Process Dashboard
The dashboard is divided into four tabs:
- Summary tab — Provides an intraday high-level summary of the backlog for the period chosen. This is intended to be the starting point for analysis, enabling you to quickly spot trends in KPI and potential bottlenecks in tasks. For example, it can enable you to quickly recognize that the backlog is growing or shrinking.
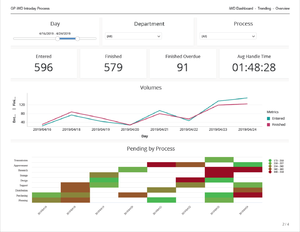
- Trending tab — Provides at-a-glance information about trends occurring in the workload processing, and helps you to understand bottlenecks and intraday processing in more detail.
- Task Handling tab — Enables you to examine how handle time may be affecting the processing of tasks, and helps you to quickly spot any exceptions.
- Finished Overdue tab — Provides insights into tasks that were not serviced before their Service Level Agreement (SLA).
To get a better idea of what this dashboard looks like, view sample output from the dashboard:
SampleiWDIntradayProcessDshbrd.pdf
The following tables explain the prompts you can select when you generate the dashboard, and the attributes and metrics that are represented in the dashboard:
Prompts for the Intraday Process Dashboard
| Prompt | Description |
|---|---|
| Pre-set Date Filter | From the list, choose a time period on which to report, and move it to the Selected list. |
| Start Date | Choose the first day from which to gather report data. |
| End Date | Choose the last day from which to gather report data. |
| Department | Optionally, select one or more departments to include in the report. |
| Process | Optionally, select one or more processes to include in the report. |
| Media Type | Optionally, select one or more media types for which to gather data into the report. |
Attributes used in the Intraday Process Dashboard
| Attribute | Description |
|---|---|
| Department | Enables data to be organized by the name of the department for which iWD prioritizes and routes tasks. |
| Process | Enables data to be organized by the name of the business process, which is a core attribute of tasks and work items that define strategies for how to route them. |
| Day | Enables data within the reporting interval to be organized by a particular day within a month and year. Day values are presented in YYYY-MM-DD format. |
Metrics used in the Intraday Process Dashboard
The Intraday Process Dashboard is divided into four tabs:
- Summary
- Trending
- Task Handling
- Finished Overdue
| Metric | Description |
|---|---|
| Summary tab | |
| Pending Diff | The difference between the Entered and Finished metrics. |
| Entered | The total number of new tasks of this classification that were submitted to iWD during the reporting interval. |
| Finished | The total number of tasks of this classification that were finished during the reporting interval. |
| Finished Overdue | The total number of finished tasks that were overdue during the reporting interval. |
| Pending | The current number of tasks that were pending (where the task status is Queued, Assigned, or Held) at the end of the reporting interval. |
| Pending Overdue | The current number of pending tasks that were overdue at the end of the reporting interval. A task is considered overdue when the SLA due date/time has been missed. |
| Trending tab | |
| Entered | The total number of new tasks of this classification that were submitted to iWD during the reporting interval. |
| Finished | The total number of tasks of this classification that were finished during the reporting interval. |
| Finished Overdue | The total number of finished tasks that were overdue during the reporting interval. |
| Pending | The current number of tasks that were pending (where the task status is Queued, Assigned, or Held) at the end of the reporting interval. |
| Avg Handle Time | The average amount of time that agents worked on tasks before the tasks were finished. |
| Task Handling tab | |
| Avg Handle Time | The average amount of time that agents worked on tasks before the tasks were finished. |
| Avg Accept Time | For finished tasks, the average amount of time that elapsed within the iWD system before tasks were assigned to a resource for the first time. This metric reflects how long, on average, tasks were backlogged. |
| Avg Finish Time | The average amount of time that elapsed before agents finished tasks. This metric includes the time that tasks were backlogged, as well as work time. |
| Finished Overdue tab | |
| Pending Overdue | The current number of pending tasks that were overdue at the end of the reporting interval. A task is considered overdue when the SLA due date/time has been missed. |
| Pending Overdue % | The percentage of pending tasks that were overdue at the end of the reporting interval. |
| Finished Overdue | The total number of finished tasks that were overdue during the reporting interval. |
| Finished Overdue % | The percentage of finished tasks of this classification that were overdue during the reporting interval. |
| Avg Handle Time | The average amount of time that agents worked on tasks before the tasks were finished. |
To view more detailed information about the metrics and attributes in this report, and other metrics and attributes that can be used to customize reports, see the Genesys CX Insights Multicloud Projects Reference Guide.


