Weekly Agent Group Performance Dashboard
Contents
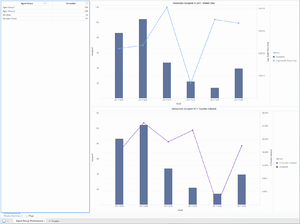
Explore weekly interaction handling at the group level on a weekly basis.
Understanding the Weekly Agent Group Performance Dashboard
The Weekly Agent Group Performance Dashboard provides two views that you can use to monitor the interaction processing performance of agent groups:
- Interaction Accepted Vs AHT - Weekly View — Charts the number of Interactions Accepted against the Average Handle Time for the selected groups.
- Interaction Accepted Vs % Transfers Initiated — Charts the number of Interactions Accepted against the percentage of interactions that were transferred from the selected groups.
The report shows data for all the groups, or for the ones you select on the prompts page. Once you have run the report, you can make a selection in the Agent Group / Accepted list to dynamically focus on a specific group. To get a better idea of what this dashboard looks like, view sample output from the dashboard:
Video: Filter by agent group
The following tables explain the prompts you can select when you generate the dashboard, and the metrics and attributes that are represented in the dashboard:
Prompts available for the the Weekly Agent Group Performance Dashboard
The following table describes prompts available for the the Weekly Agent Group Performance Dashboard:
| Prompt | Description |
|---|---|
| Pre-set Date Filter | From the convenient list of predefined dates, choose a date for which to run the report. |
| Start Date | Choose the first day from which to gather data into the dashboard. |
| End Date | Choose the last day from which to gather data into the dashboard. |
| Agent Group | Optionally, select one or more agent groups on which to focus the report. |
| Media Type | Optionally, select one or more media types to include in the report—for example, VOICE, EMAIL, and CHAT. |
| Interaction Type | Optionally, select the type of interaction to include in the report—for example, Inbound, Outbound, and Internal. |
| Tenant | For multi-tenant environments, optionally select one or more tenants on which to focus the report. |
Attributes used in the Weekly Agent Group Performance Dashboard
The following table describes attributes used on the Weekly Agent Group Performance Dashboard:
| Attribute | Description |
|---|---|
| Agent Group | Click values in this column to focus the report on specific groups. |
| Week | Enables data within the reporting interval to be organized by a particular week (1-53). |
Metrics used in the Weekly Agent Group Performance Dashboard
The following table describes metrics used on the Weekly Agent Group Performance Dashboard:
| Metric | Description |
|---|---|
| Accepted | The total number of times that customer interactions or warm consultations were accepted, answered, pulled, or initiated by agents who belong to this agent group. |
| Avg Handle Time (Fmt) | The average amount of time, in seconds, that agents who belong to this agent group spent handling interactions that the agents received.
This metric is computed as handle time divided by the sum of accepted interactions and received consultations. |
| % Transfer Initiated | The percentage of accepted customer interactions |
To view more detailed information about the metrics and attributes in this dashboard, and other metrics and attributes that can be used to customize reports, see the Genesys CX Insights Projects Reference Guide.

