Weekly Business Attribute Dashboard
Contents
Explore interaction business-result categorization on a weekly basis.
Understanding the Weekly Business Attribute Dashboard
The Weekly Business Attribute Dashboard has a tab for each tenant, which is further subdivided into two tabs:
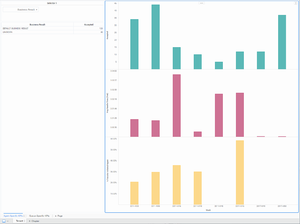
- Agent-Specific KPIs tab — Visualizations of the weekly volume of interactions agents accepted, average handle time, and the percentage of interactions that were transferred. Use the Business Result list to quickly focus the visualization on one result.
- Queue-Specific KPIs tab — Visualizations of the weekly values representing critical queue KPIs: Entered with Objective, ASA, First Response Time, and Abandoned Waiting. Use the Business Result list to quickly focus the visualization on one result.
If the business-result classification changes during an interaction, Genesys Info Mart attributes the business result that is in effect when interaction handling ends to the business result that is attached to the interaction. More accurately, the business result that is associated with the interaction at the end of the segment with the first handling resource is attached to the interaction.
To get a better idea of what this dashboard looks like, view sample output from the dashboard:
Video: Focusing the dashboard
The following tables explain the prompts you can select when you generate the dashboard, and the metrics and attributes that are represented in the dashboard:
Prompts available the Weekly Business Attribute Dashboard
The following table lists prompts available for the Weekly Business Attribute Dashboard:
| Prompt | Description |
|---|---|
| Pre-set Date Filter | From the convenient list of predefined dates, choose a date for which to run the report. |
| Start Date | Choose the first day from which to gather data into the dashboard. |
| End Date | Choose the last day from which to gather data into the dashboard. |
| Business Result | Optionally, select one or more business results on which to focus the report. |
| Customer Segment | Optionally, select one or more customer segments on which to focus the report. |
| Service Type | Optionally, select one or more service types on which to focus the report. |
| Media Type | Optionally, select one or more media types to include in the report—for example, VOICE, EMAIL, and CHAT. |
| Interaction Type | Optionally, select the type of interaction to include in the report—for example, Inbound, Outbound, and Internal. |
| Tenant | For multi-tenant environments, optionally select one or more tenants on which to focus the report. |
Attributes used on the Weekly Business Attribute Dashboard
The following table lists attributes used on the Weekly Business Attribute Dashboard:
| Attribute | Description |
|---|---|
| Business Result | Click values in this column to focus the report on specific business results. |
| Week | Enables data within the reporting interval to be organized by a particular week (1-53). |
Metrics used on the Weekly Business Attribute Dashboard
The following table lists metrics used on the Weekly Business Attribute Dashboard:
| Metric | Description |
|---|---|
| Accepted | The total number of customer interactions of this business attribute that were accepted, answered, pulled, or initiated by a handling resource. |
| Avg Handle Time (Fmt) | The average amount of time (HH:MM:SS) that agents spent handling interactions assigned this business attribute. |
| % Transfer Initiated Agent | The percentage of customer interactions of this business attribute that agents transferred.
Both warm and blind transfers are reflected in this metric. |
| Entered With Objective | The total number of customer interactions that entered or began within the contact center, were assigned this business attribute, and either had a baseline service objective or a response threshold (defined in the [agg-gim-thld-QUEUE-IXN] section) that was greater than zero. |
| ASA (Fmt) | The average amount of time (HH:MM:SS) it took agents to accept, answer, or pull customer interactions assigned this business attribute.
This metric is identical to BA Customer\Avg Accept Time Agent. |
| % First Response Time Service Level | The service level that is delivered for this business attribute, measured as a percentage of customer interactions that were accepted within a user-defined threshold, relative to all customer interactions that were offered to handling resources. |
| % Abandoned Waiting | The percentage of customer interactions of this business attribute that were abandoned, relative to the total number of customer interactions of this business attribute that entered or began within the contact center during the interval. |
To view more detailed information about the metrics and attributes in this dashboard, and other metrics and attributes that can be used to customize reports, see the Genesys CX Insights Projects Reference Guide.

