Predictive Routing - AHT & Queue Dashboard
Contents
Evaluate the impact that enabling Genesys Predictive Routing (GPR) has on your contact center efficiency.
The (Predictive Routing folder) Predictive Routing - AHT & Queue Dashboard provides a dashboard-style summary that you can use to evaluate the impact on contact center efficiency of enabling Genesys Predictive Routing (GPR). The dashboard provides tools that allow you to compare how various metrics change when GPR is enabled. The Predictive Routing - AHT & Queue Dashboard contains two tabs: AHT and Queue.
To get a better idea of what this dashboard looks like, view sample output from the report:
Video: AHT & Queue Dashboard
The AHT tab
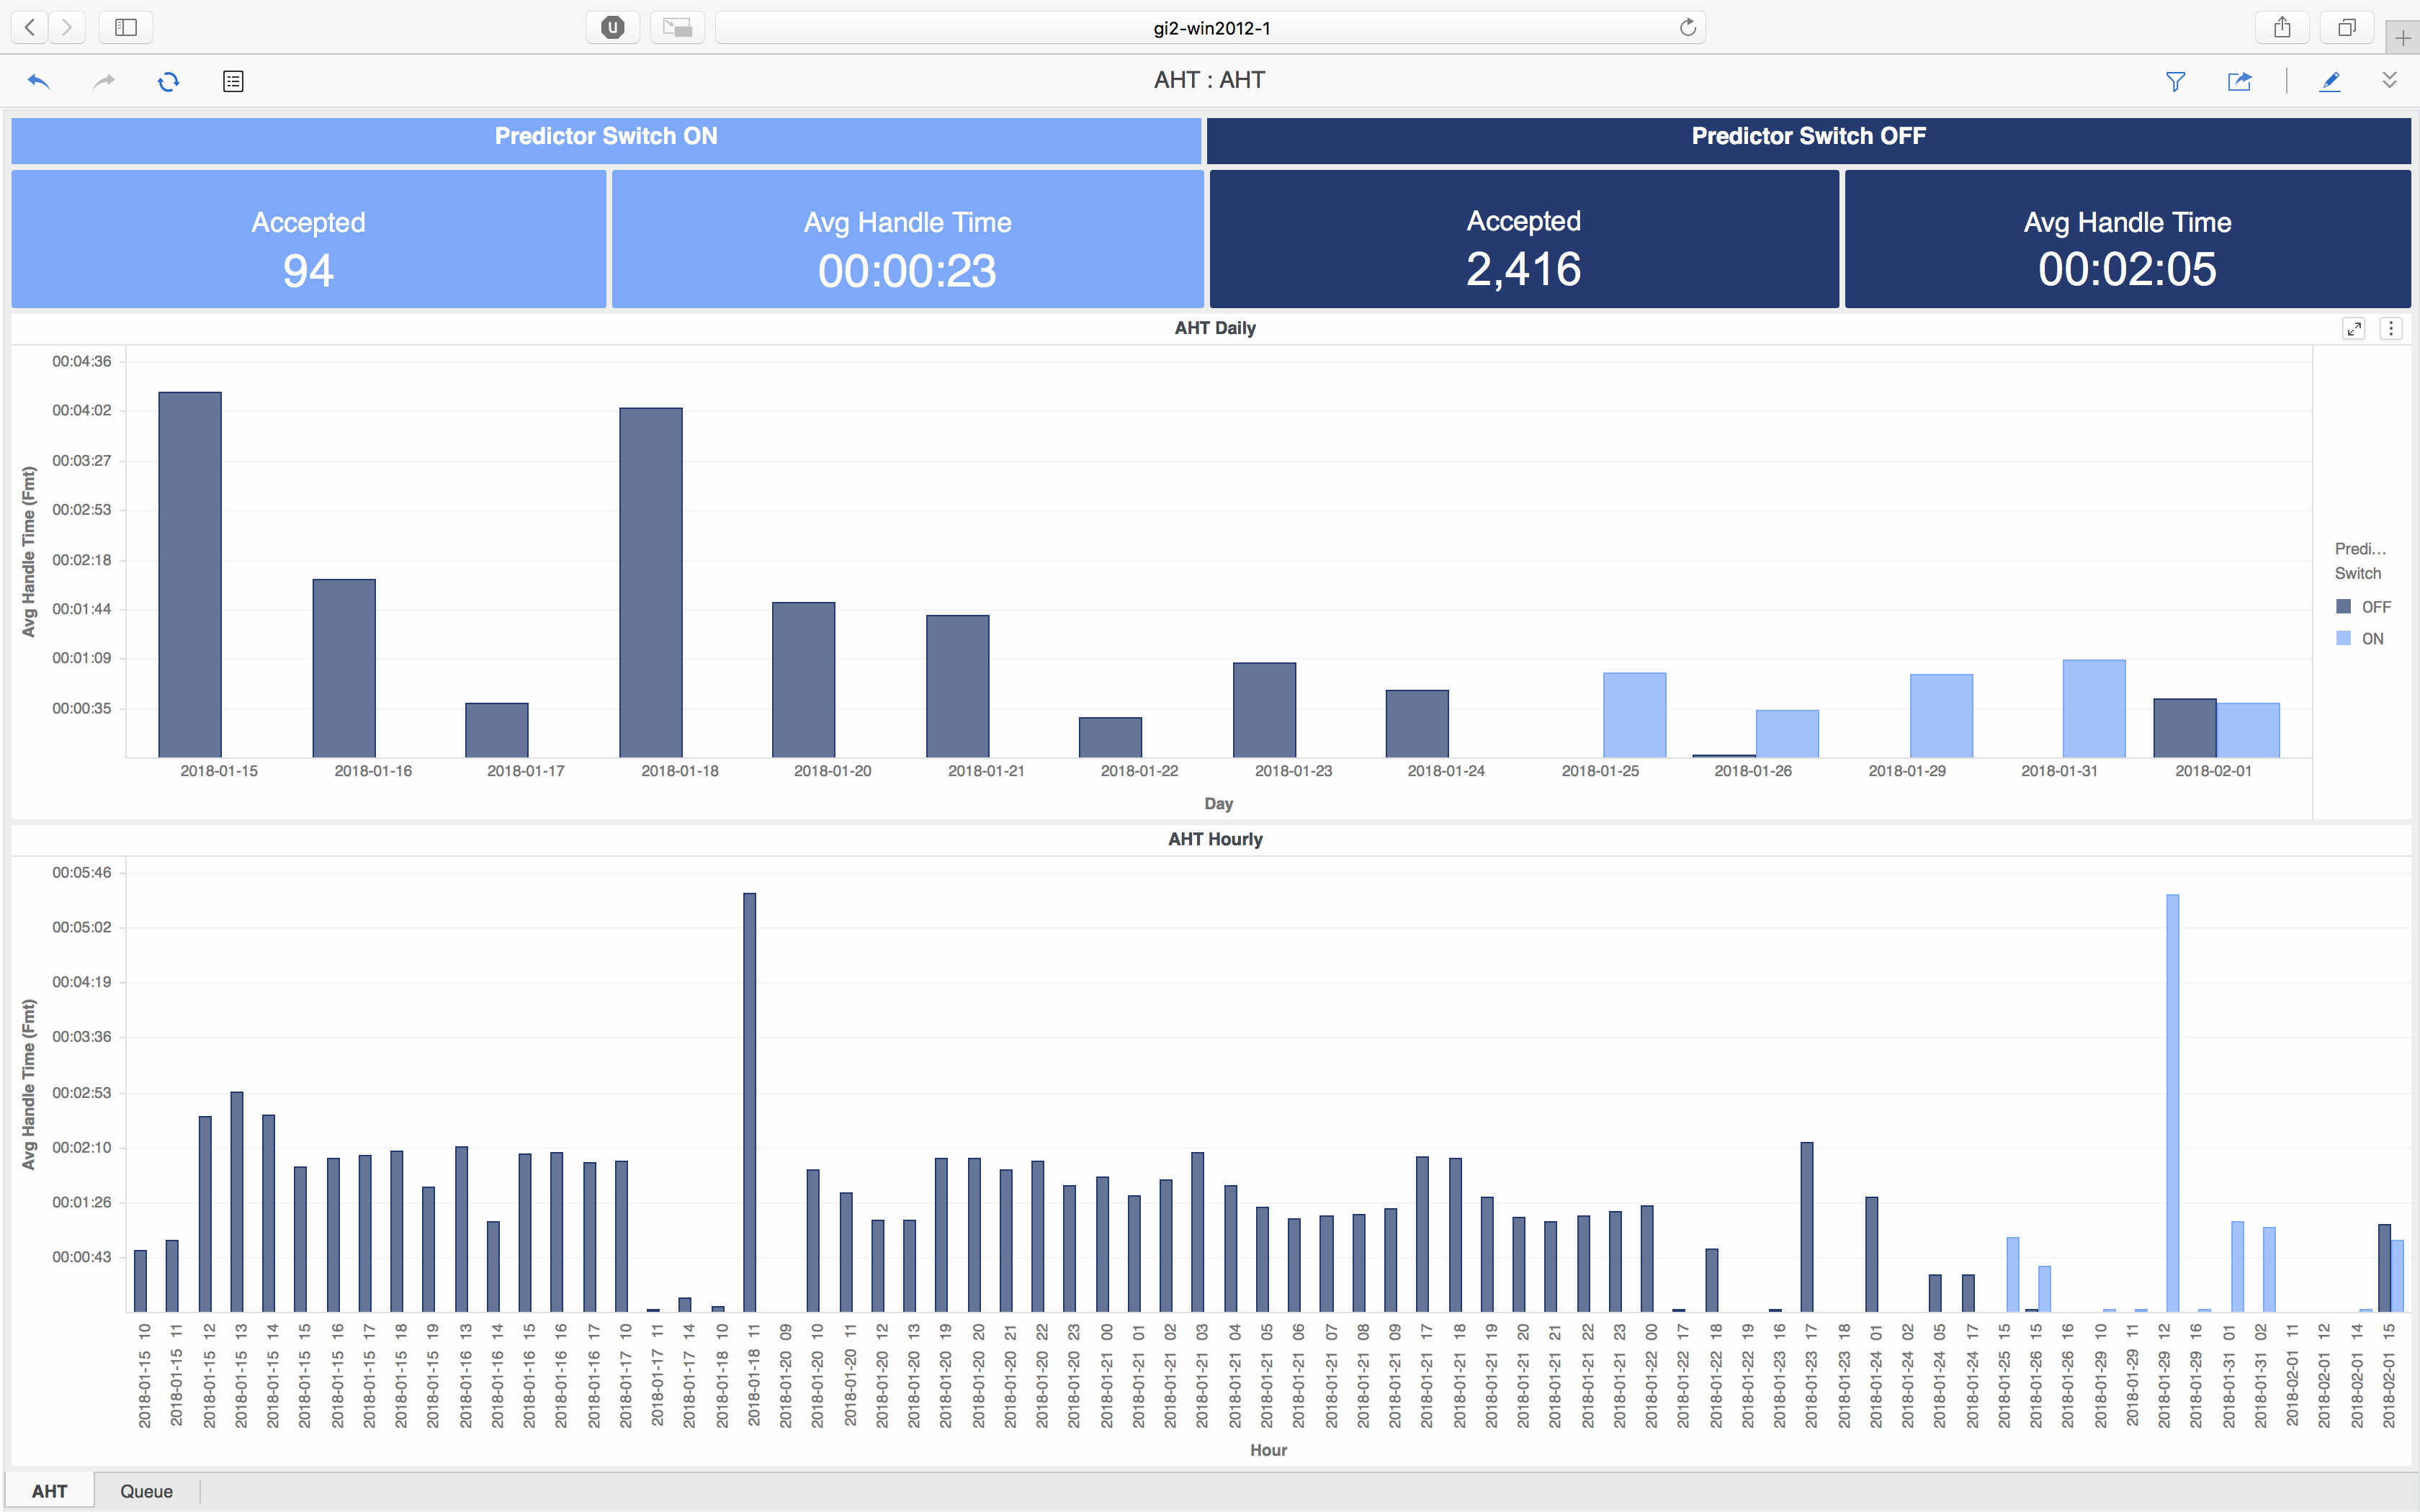
The AHT tab — This tab provides detailed information about Average Handle Time (AHT) and related metrics. The AHT dashboard is divided into three sections:
- The top part of the dashboard shows side-by-side comparisons of key metrics (Accepted and Average Handle Time); the values on the left represent the result of having GPR on, while on the right, you can see the result of turning it off.
- The middle part of the dashboard shows the Average Handle Time, broken down by day, contrasting the result of enabling/disabling GPR (the light-colored bars represent data collected when GPR was enabled, while the dark bards represent data collected when GPR was disabled). The higher the bar, the longer the handle time was on the indicated day.The bottom part of the dashboard breaks down Average Handle Time on an hour-by-hour basis, and once again contrasting the result of enabling/disabling GPR.
Initially, the entire reporting period is presented in this part of the dashboard, but you can filter to focus on a single day, or a range of days: In the middle part of the dashboard, select one or more days (click the bar in the graph, or click and drag to select more than one); the bottom part of the dashboard updates to show the hourly trends for those days.
The Queue tab
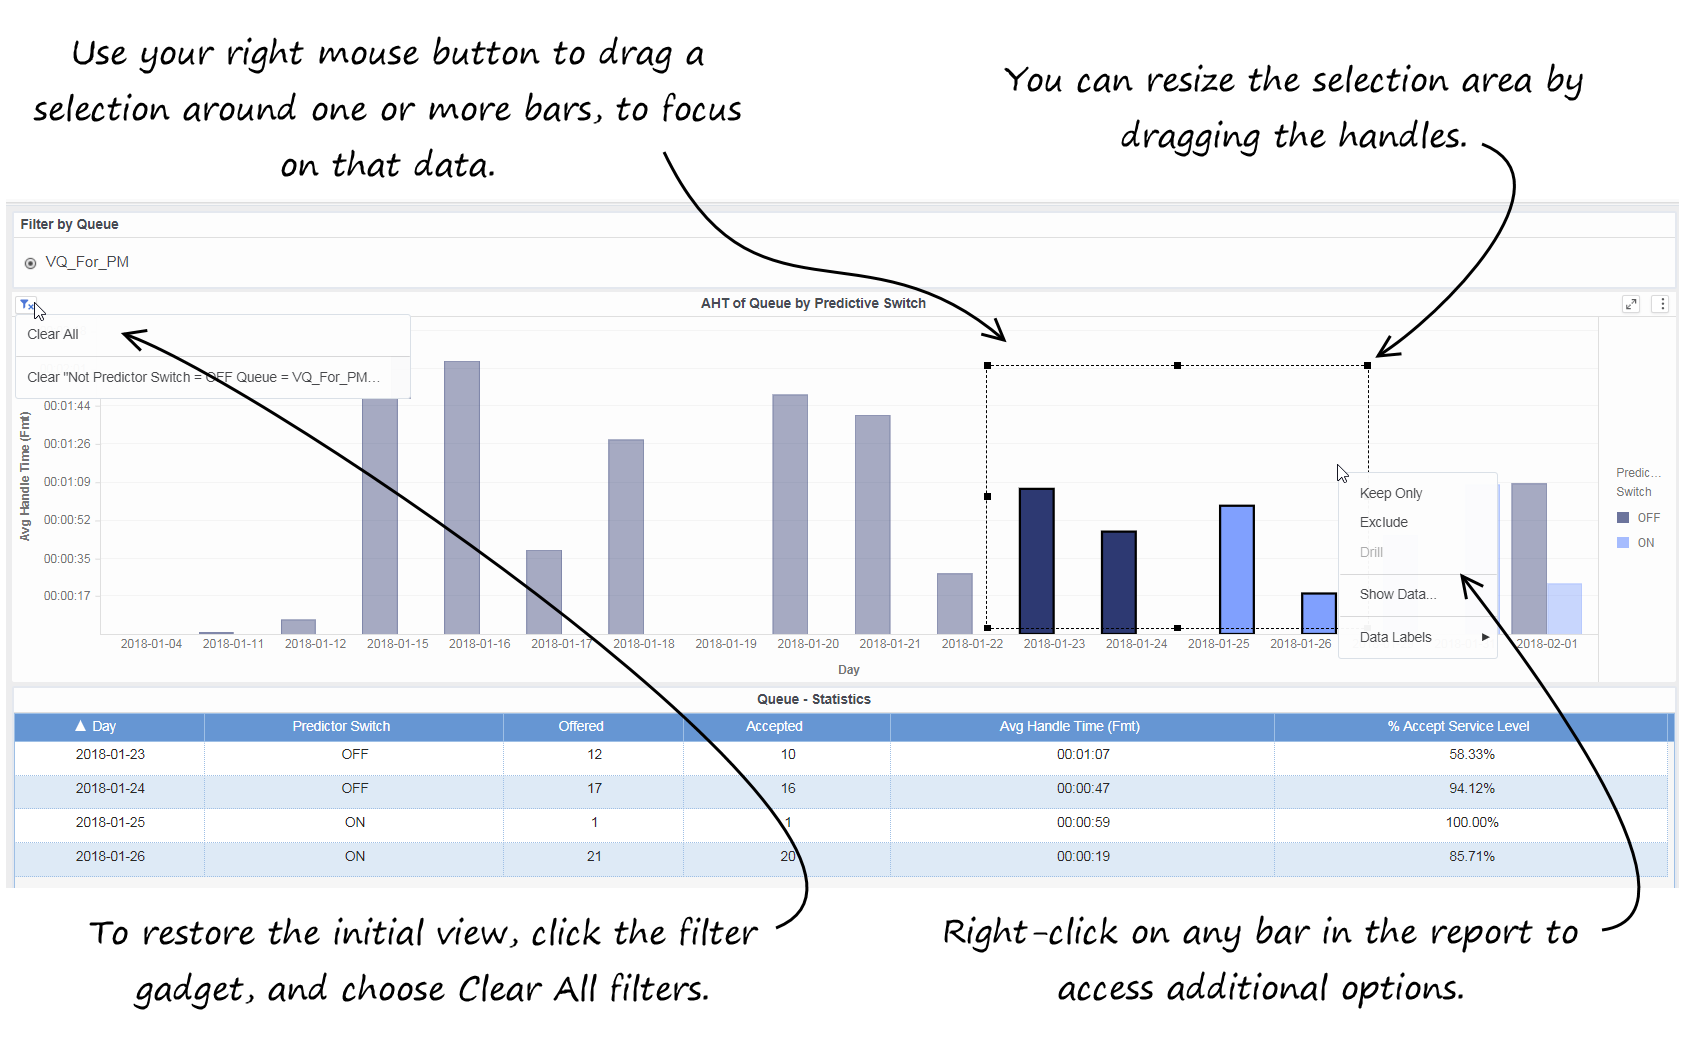
The Queue tab — This tab allows you to easily compare the Average Handle Time with Predicitve Switching on/off per queue; here you will see the same kind of information that appears on the AHT tab, but here it is organized by Queue. The Queue tab is useful if you find an unsatisfactory AHT — for example, if AHT seems higher with Predictive Switching turned on — you can use the Queue tab to see if a particular queue is the source of the problem.
This dashboard relies on First Contact Resolution (FCR) data from the Predictive Routing A/B Testing Report. FCR data is processed only after 7 days have elapsed, so FCR data that appears in this report is at least 7 days old.Prompts
The following table explains the prompts you can select when you generate the Predictive Routing - AHT & Queue Dashboard:
| Prompt | Description |
|---|---|
| Pre-set Date Filter | Choose a date from the list of preset options. If this prompt is set to anything other than none, the Report Date prompt is ignored. Default: Year to Date |
| Start Date | Choose the first date on which to report. This prompt has no effect if Pre-set Date Filter is set to anything other than none. |
| End Date | Choose the last date on which to report. This prompt has no effect if Pre-set Date Filter is set to anything other than none. |
| Queue | Select one or more queues to include in the report. |
| Media Type | Select one or more media types for which to gather data into the report. |
| Predictor | Select one or more predictors to include in the report. |
| Model | Select one or more prediction models to include in the report. |
| Tenant | Select one or more tenants to include in the report. |
Metrics and attributes on the AHT tab
The following table explains the attributes used on the AHT tab:
| Attribute | Description |
|---|---|
| Day | Enables the organization of data based on the day/date on which the interaction occurred. |
| Hour | Enables the organization of data based on the hour at which the interaction occurred. |
| Predictor Switch | Enables the organization of data based on whether predictive routing is ON or OFF. |
The following table explains the metrics used on the AHT tab:
| Metrics | Description |
|---|---|
| Accepted | Total number of calls that were accepted. |
| Avg Handle Time | The average amount of time that agents spent handling each interaction. |
Metrics and attributes on the Queue tab
The following table explains the attributes used on the Queue tab:
| Attribute | Description |
|---|---|
| Day | Enables the organization of data based on the day/date on which the interaction occurred. |
| Predictor Switch | Enables the organization of data based on whether predictive routing is ON or OFF. |
| Queue | Enables the organization of data by queue. |
The following table explains the metrics used on the Queue tab:
| Metrics | Description |
|---|---|
| Accepted | The total number of customer interactions and warm consultations that were accepted, answered, or pulled by an agent, voice-treatment port, IVR port, or nonagent-associated DN (such as contact center resources that can alert) within the reporting interval. |
| AHT of Queue by Predictor Switch | The Average Handle Time for interactions in the selected queue, where dark blue bars capture information about interactions that completed while Predictor Switch was On, and light blue bars capture information about interactions that completed while Predictor Switch was Off. |
| Offered | The total number of customer interactions that entered or began within the contact center during the reporting interval, and were offered to a resource, excluding interactions that were abandoned within the short-abandoned threshold. |
| Avg Handle Time | The average amount of time (HH:MM:SS), within the reporting interval, that agents spent handling received interactions. Computed as handle time divided by the sum of accepted interactions and received consultations. |
| % Accept Service Level | The service level, measured as a percentage of interactions that entered this tenant and were accepted within a user-defined threshold, relative to all interactions that entered this tenant and were offered to a resource. |


