Predictive Routing Queue Statistics Report
Contents
Evaluate the impact that enabling Genesys Predictive Routing (GPR) has on queue-related Key Performance Indicators (KPI).
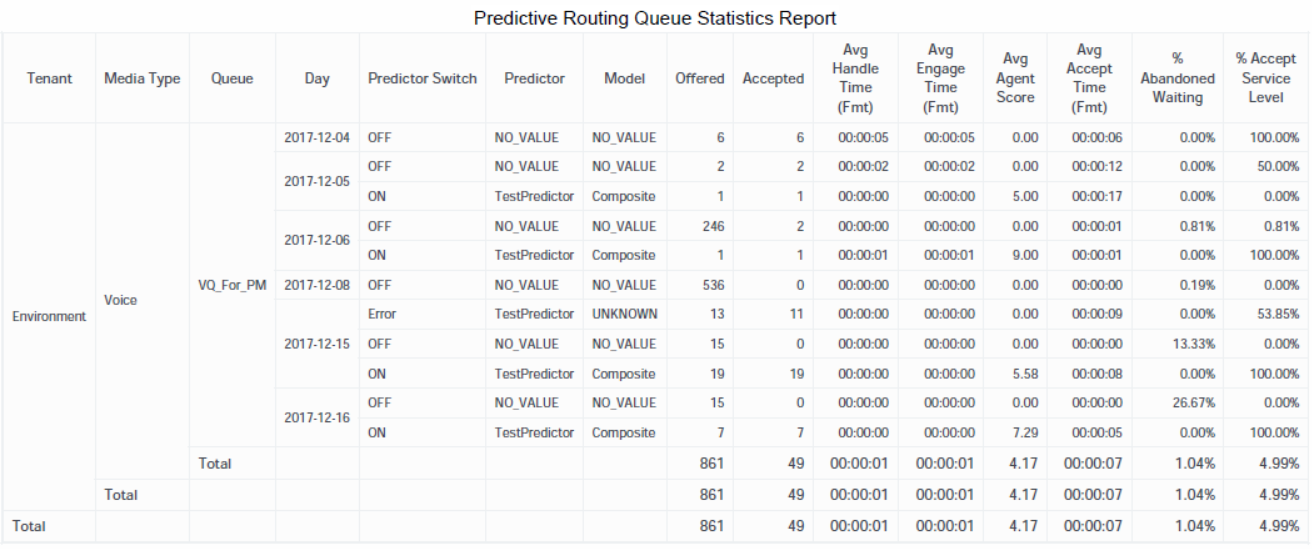
Use the (Predictive Routing folder) Predictive Routing Queue Statistics Report to track KPIs for each queue when Genesys Predictive Routing (GPR) is used to optimize routing. The report allows you to monitor overall interaction-processing performance of queues, including contrasting, for each Model and Predictor, the number of Offered and Accepted interactions, Accept, Handle, and Engage Time, as well as abandoned and service level metrics.
To get a better idea of what this report looks like, view sample output from the report: Sample_Predictive Routing_Queue_Statistics_Report.pdfThe following tables explain the prompts, attributes, and metrics used in this report:
Prompts in the Predictive Routing Queue Statistics Report
| Prompt | Description |
|---|---|
| Pre-set Date Filter | Choose a date from the list of preset options. This prompt overrides the Start Time and End Time values. Default: Year to Date. |
| Start Date | Choose the date from which to begin collecting data into the report. This prompt has no effect if Pre-set Date Filter is set to anything except none. |
| End Date | Choose the date at which to stop collecting data into the report. This prompt has no effect if Pre-set Date Filter is set to anything except none. |
| Queue | Select one or more queues from which to gather data into the report. |
| Media Type | Select one or more media types to include in the report. |
| Predictor | Select one or more predictors to include in the report. |
| Model | Select one or more models to include in the report. |
| Tenant | Select one or more tenants to include in the report. |
Attributes in the Predictive Routing Queue Statistics Report
| Attribute | Description |
|---|---|
| Tenant | Enables the organization of data based on the specific tenant or business unit for a customer deployment. |
| Media Type | Enables the organization of data based on the media type of the interaction—for example, VOICE, EMAIL, and CHAT. |
| Queue | Enables the organization of data based on the name of the ACD queue, virtual queue, interaction queue, or workbin. |
| Day | Enables the organization of data based on the day/date on which the interaction occurred. |
| Predictor Switch | Enables the organization of data based on whether predictive routing is ON, OFF, or Error. Calls with a Result value of <tt>9</tt> are described as OFF. |
| Predictor | Enables the organization of data based on the identifier for the predictor that was used to request scoring for predictive routing. (PREDICTOR ID - PREDICTOR NAME) |
| Model | Enables the organization of data based on the identifier for the model that was used to calculate agent scores for predictive routing. (MODEL ID - MODEL DESC) |
| Result | Enables the organization of data based on the result of Predictive Routing processing. If there is an error, this metric displays the error message (gpmMessage) as a value between 1 and 15, where:
|
Metrics in the Predictive Routing Queue Statistics Report
| Metric | Description |
|---|---|
| Offered | The total number of interactions that entered this queue and were subsequently offered to a resource. This count includes interactions that could not be offered because no agent was in the Ready state. |
| Accepted | The total number of times that customer interactions and warm consultations that were distributed from this queue, were accepted, answered, or pulled by an agent, voice-treatment port, IVR port, or nonagent-associated DN (such as contact center resources that can alert). |
| Avg Handle Time (Fmt) | The average amount of time (HH:MM:SS) that agents spent handling customer interactions or warm consultations that were distributed or pulled from this queue. |
| Avg Engage Time (Fmt) | For customer interactions that were distributed or pulled from this queue, the average amount of time (HH:MM:SS) that agents were engaged with customers. |
| Avg Agent Score | Calculated as the sum of all Agent Scores (gpmAgentScore), divided by the total number of interactions that were distributed from this queue, where GPR was active. |
| Avg Accept Time (Fmt) | The average amount of time (HH:MM:SS) that customers waited before their interactions—distributed from this queue—were accepted by a handling resource. |
| % Abandoned Waiting | The percentage of customer interactions that both entered this queue and were subsequently abandoned before the interactions could be distributed, relative to the total number of interactions that entered this queue. |
| % Accept Service Level | The service level of this queue measured as a percentage of interactions that entered this queue and were accepted within the acceptance threshold, relative to all interactions that entered this queue and were offered to a resource. |
To view more detailed information about the metrics and attributes in this report, and other metrics and attributes that can be used to customize reports, see the Genesys CX Insights Projects Reference Guide.

