Resource Performance Dashboard
Analyze the amount of time and effort required to resolve work items.
Use the Resource Performance Dashboard to gain insight into the amount of time and effort resources are spending to resolve work items, and to quickly identify which days, departments, and processes are occupying resource time.
The dashboard organizes data on the following tabs:
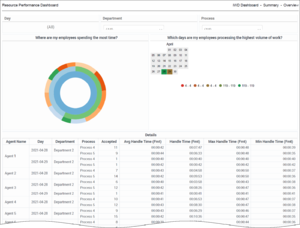
- Summary tab — This tab provides an at-a-glance view of handling resource activity as follows:
- Where are my employees spending the most time?
- Which days are my employees processing the highest volume of work?
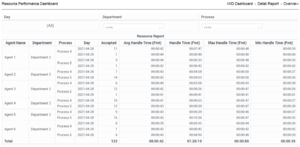
- Detail Report tab — This tab provides insights into the number of interactions, and a detailed breakdown of handle time for each handling resource.
Note that the term 'dashboard' is used interchangeably with the term 'dossier’. Dashboards / dossiers provide an interactive, intuitive data visualization, summarizing key business indicators (KPIs). You can change how you view the data in most reports and dashboards by using interactive features such as selectors, grouping, widgets, and visualizations, and explore data using multiple paths, through text and data filtering, and layers of organization.
To get a better idea of what this dashboard looks like, view sample output from the dashboard:
Sample Resource Performance Dashboard.pdf
The following table explains the prompts you can select when you generate the Resource Performance Dashboard:
| Prompt | Description |
|---|---|
| Pre-set Date Filter | Choose a time range from the list, and move it to the Selected list. |
| Start Date | Choose the first day from which to gather report data. |
| End Date | Choose the last day from which to gather report data. |
| Department | Optionally, select one or more departments on which to report. |
| Process | Optionally, select one or more business processes on which to report. |
| Agent Name | Optionally, select the name of the agent on which to focus the report. |
| Media Type | Optionally, select one or more media types for which to gather data into the report. |
The following table explains the attributes used in the Resource Performance Dashboard:
| Attribute | Description |
|---|---|
| Department | Enables data to be organized by the name of the department for which iWD prioritizes and routes tasks. |
| Process | Enables data to be organized by the name of the business process. The business process name is a core attribute that is used to define strategies for how to route tasks and work items. |
| Agent Name | Enables data to be organized by agent name. |
| Day | Enables data within the reporting interval to be organized by a particular day within a month and year. Day values are presented in YYYY-MM-DD format. |
The following table explains the metrics used in the Resource Performance Dashboard:
| Metric | Description |
|---|---|
| Handle Time (Fmt) | The total amount of time, in seconds, that this resource worked on tasks before finishing them. This duration is measured as the difference between the time when the resource is assigned to a task, and the time when the task is finished.
Note that the act of a resource finishing a task within the iWD system does not, in and of itself, mark the task Completed—one of three states that indicate task finalization. A task can have multiple work items. This metric considers active as well as completed tasks in its computation. |
| Accepted | For completed tasks, the total number of tasks that were assigned to this resource during the reporting interval. |
| Avg Handle Time (Fmt) | The average amount of time that this resource (for example, an agent) worked on tasks before finishing them. Note that the act of a resource finishing a task within the iWD system does not, in and of itself, mark the task Completed—one of three states that indicate task finalization. This metric considers active as well as completed tasks in its computation. |
| Max Handle Time (Fmt) | The longest amount of time that this resource worked on a task before finishing it. Finishing a task within the iWD system does not necessarily imply that the task was Completed—one of three states that indicate task finalization. This measure considers active as well as completed tasks in its computation. |
| Min Handle Time (Fmt) | The shortest amount of time that this resource worked a task before finishing it. Finishing a task within the iWD system does not necessarily imply that the task was Completed—one of three states that indicate task finalization. This metric considers active as well as completed tasks in its computation. |
To view more detailed information about the metrics and attributes in this report, and other metrics and attributes that can be used to customize reports, see the [1]Genesys CX Insights Multicloud Projects Reference Guide.


