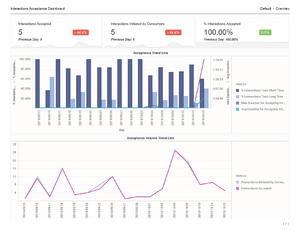
Interactions Acceptance Dashboard
Analyze the number and percentage of customer interactions that are accepted promptly, compared to those that encounter a delay.
Understanding the Interactions Acceptance Dashboard
This page describes how you can use the (Chat folder) Interactions Acceptance Dashboard to understand how long it takes for agents to accept customer interactions, and to identify what percentage of interactions are accepted promptly, or with some delay.
Note that the term 'dashboard' is used interchangeably with the term 'dossier’. Dashboards / dossiers provide an interactive, intuitive data visualization, summarizing key business indicators (KPIs). You can change how you view the data by using interactive features such as selectors, grouping, widgets, and visualizations, and explore data using multiple paths, though text, data filtering, and layers of organization.The Interactions Acceptance Dashboard shows detailed statistics about the speed and rate of agent acceptance of customer interactions. The report displays the time it takes for agents to accept interactions, and the percentage of interactions that are accepted promptly, or with some delay. Use this report to understand interaction acceptance rate and speed, which you can use to optimize agent performance and, by monitoring the time that customers wait before connecting to an agent, help to improve customer experience.
To get a better idea of what this dashboard looks like, view sample output from the report:
Sample Interactions Acceptance Dashboard.pdf
The following table explains the prompts you can select when you generate the Interactions Acceptance Dashboard:
| Prompt | Description |
|---|---|
| Pre-set Date Filter | Choose a time period from the list of preset options. and move it to the Selected list. If this prompt is set to anything other than none, the Dates prompt are ignored. Default: Year to Date |
| Start Date | Choose the first day from which gather report data. If the Pre-set Date Filter is set to any value except none, this prompt has no effect, unless the time period selected for Pre-set Date Filter contains no data. |
| End Date | Choose the last day from which gather report data. If the Pre-set Date Filter is set to any value except none, this prompt has no effect, unless the time period selected for Pre-set Date Filter contains no data. |
| Media Type | Optionally, select the type of media to include in the report—for example, CHAT, Facebook, Twitter, or SMS. See the table Media Type vs Media Origin for more information. |
| Tenant | Optionally, select one or more tenants to include in the report. |
| Agent Group | Optionally, select one or more Agent Groups from which to gather data into the report. |
| Media Origin | Optionally, select the chat session place of origin—for example, CHAT, Facebook, Twitter, or SMS. See the table Media Type vs Media Origin for more information. |
The following table explains how Media Type differs from Media Origin.
| Media | Media Type | Media Origin |
|---|---|---|
| Chat | CHAT | Chat |
| Facebook private messaging | CHAT | |
| Facebook public messaging | ||
| Twitter direct message | CHAT | |
| SMS | SMS | SMS |
The following table explains the attributes used on the Interactions Acceptance Dashboard:
| Attribute | Description |
|---|---|
| Tenant | Enables data within the reporting interval to be organized by tenant. |
| Media Type | Enables data within the reporting interval to be organized by media type—for example, CHAT, Facebook, Twitter, or SMS. See the table Media Type vs Media Origin for more information. |
| Media Origin | Enables data to be organized based on where the chat session originated; for example, Chat, Facebook, Twitter, or SMS. |
| Agent Group | Enables data within the reporting interval to be organized by the groups to which agents belong. An agent can belong to more than one agent group. |
| Agent Name | Enables data to be organized by certain attributes of the agent who is associated with the interaction. |
| Day | Enables data within the reporting interval to be organized by a particular day. |
The following table explains the metrics used on the Interactions Acceptance Dashboard:
| Metrics | Description |
|---|---|
| Interactions Accepted | The number of Interactions accepted during the reporting period. This metric is identical to Chat > Agent > Accepted. |
| Interactions Initiated by Consumers | The total number of engagements that were offered to agents. Identical to the metric 'Interactions Initiated by Consumers'. This metric is identical to Chat > Agent > Offered. |
| % Interactions Accepted | The percentage of interactions which were accepted, relative to the total number of interactions initiated by customers. This metric is identical to Chat > Agent > Acceptance Rate. |
| Avg Duration for Accepting Interactions | The average amount of time (h:mm:ss) that passed after an engagement was offered, before it was accepted by an agent. |
| Max Duration for Accepting Interactions | The maximum amount of time (h:mm:ss) that passed after an engagement was offered, before it was accepted by an agent. |
| % Interactions Less Time to Accept | The percentage of interactions that were accepted by an agent before the amount of time configured as the value of the option accepted-duration-threshold in the agg-gim-thld-CHAT-ACC section. |
| % Interactions Long Time to Accept | The percentage of interactions that were accepted by an agent after the amount of time configured as the value of the option accepted-duration-threshold in the agg-gim-thld-CHAT-ACC section. |
To view more detailed information about the metrics and attributes in this report, and other metrics and attributes that can be used to customize reports, see the Genesys CX Insights Projects Reference Guide.

