Predictive Routing Agent Occupancy Dashboard
Contents
Evaluate the impact that enabling Genesys Predictive Routing (GPR) has on the use of agent's time.
The (Predictive Routing folder) Predictive Routing Agent Occupancy Dashboard provides a summary that you can use to evaluate the impact on contact center efficiency of enabling GPR.
To get a better idea of what this dashboard looks like, view sample output from the report:
Video: Introducing the Agent Occupancy Dashboard
Understanding the Agent Occupancy Dashboard
The report includes three tabs:
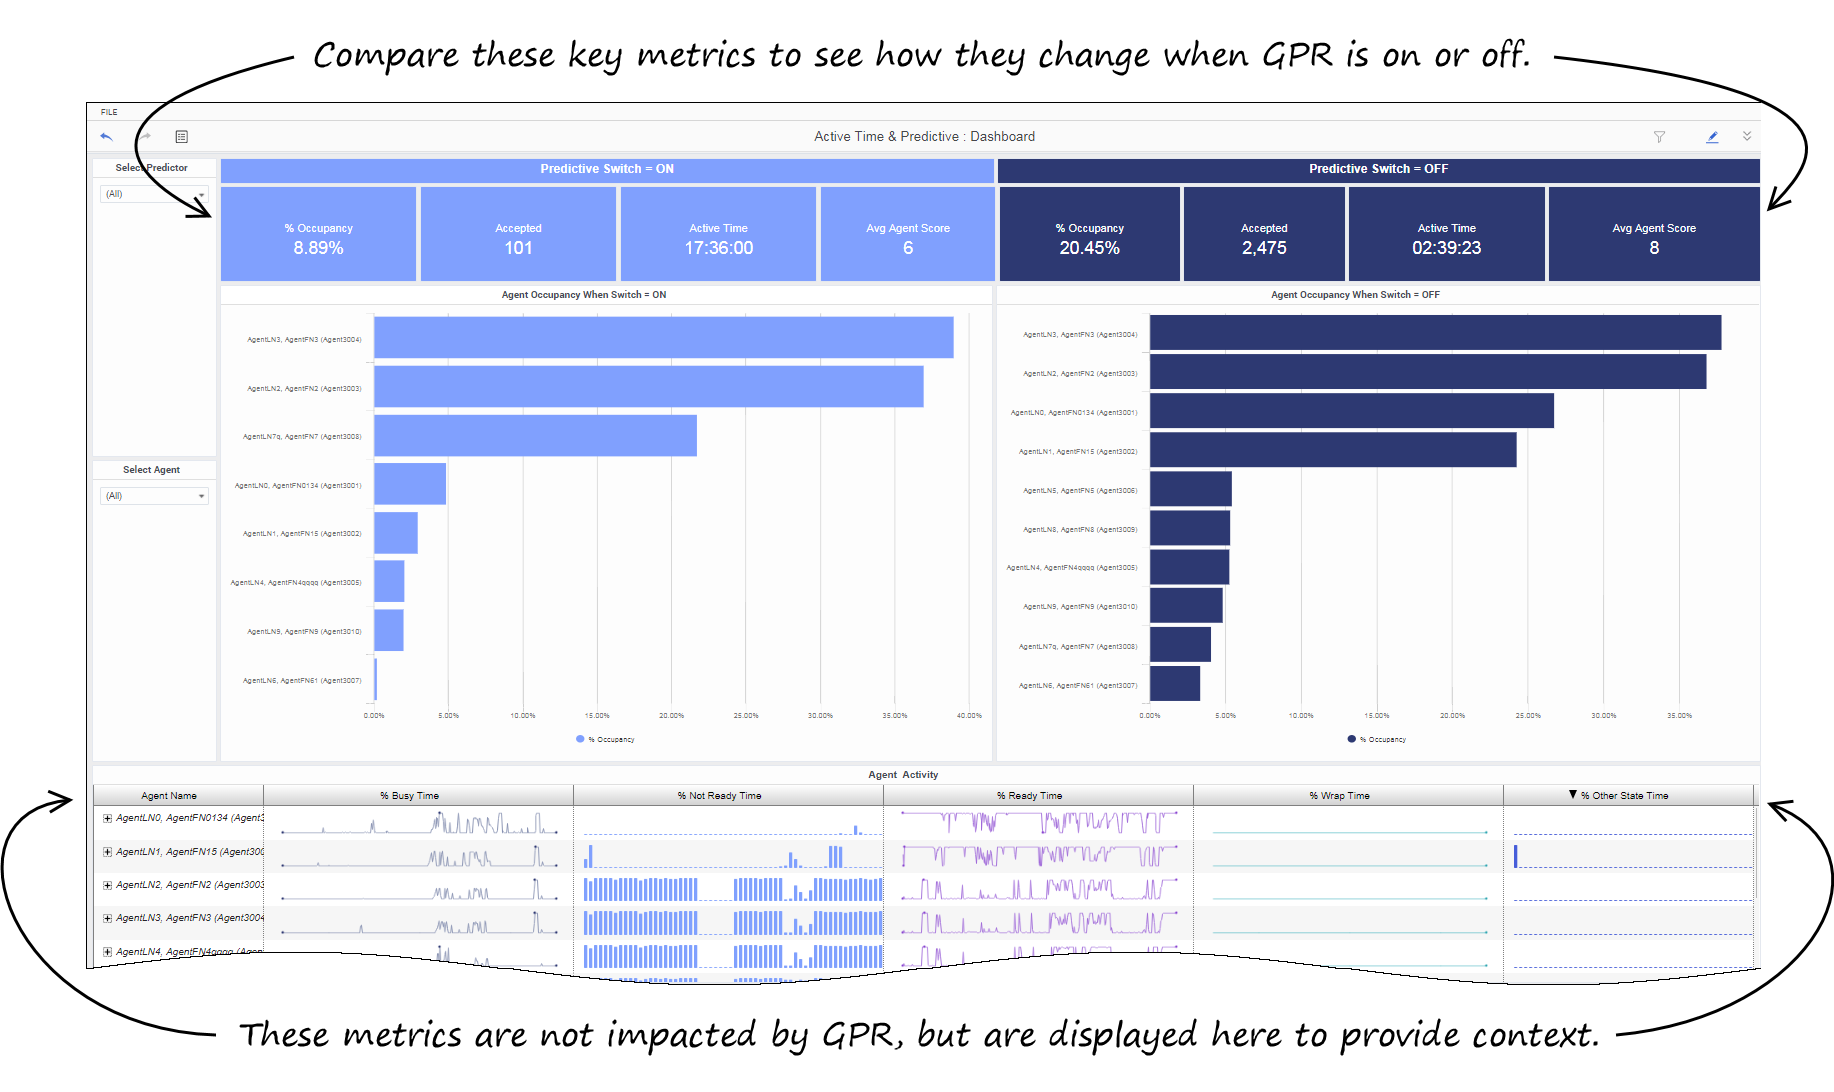
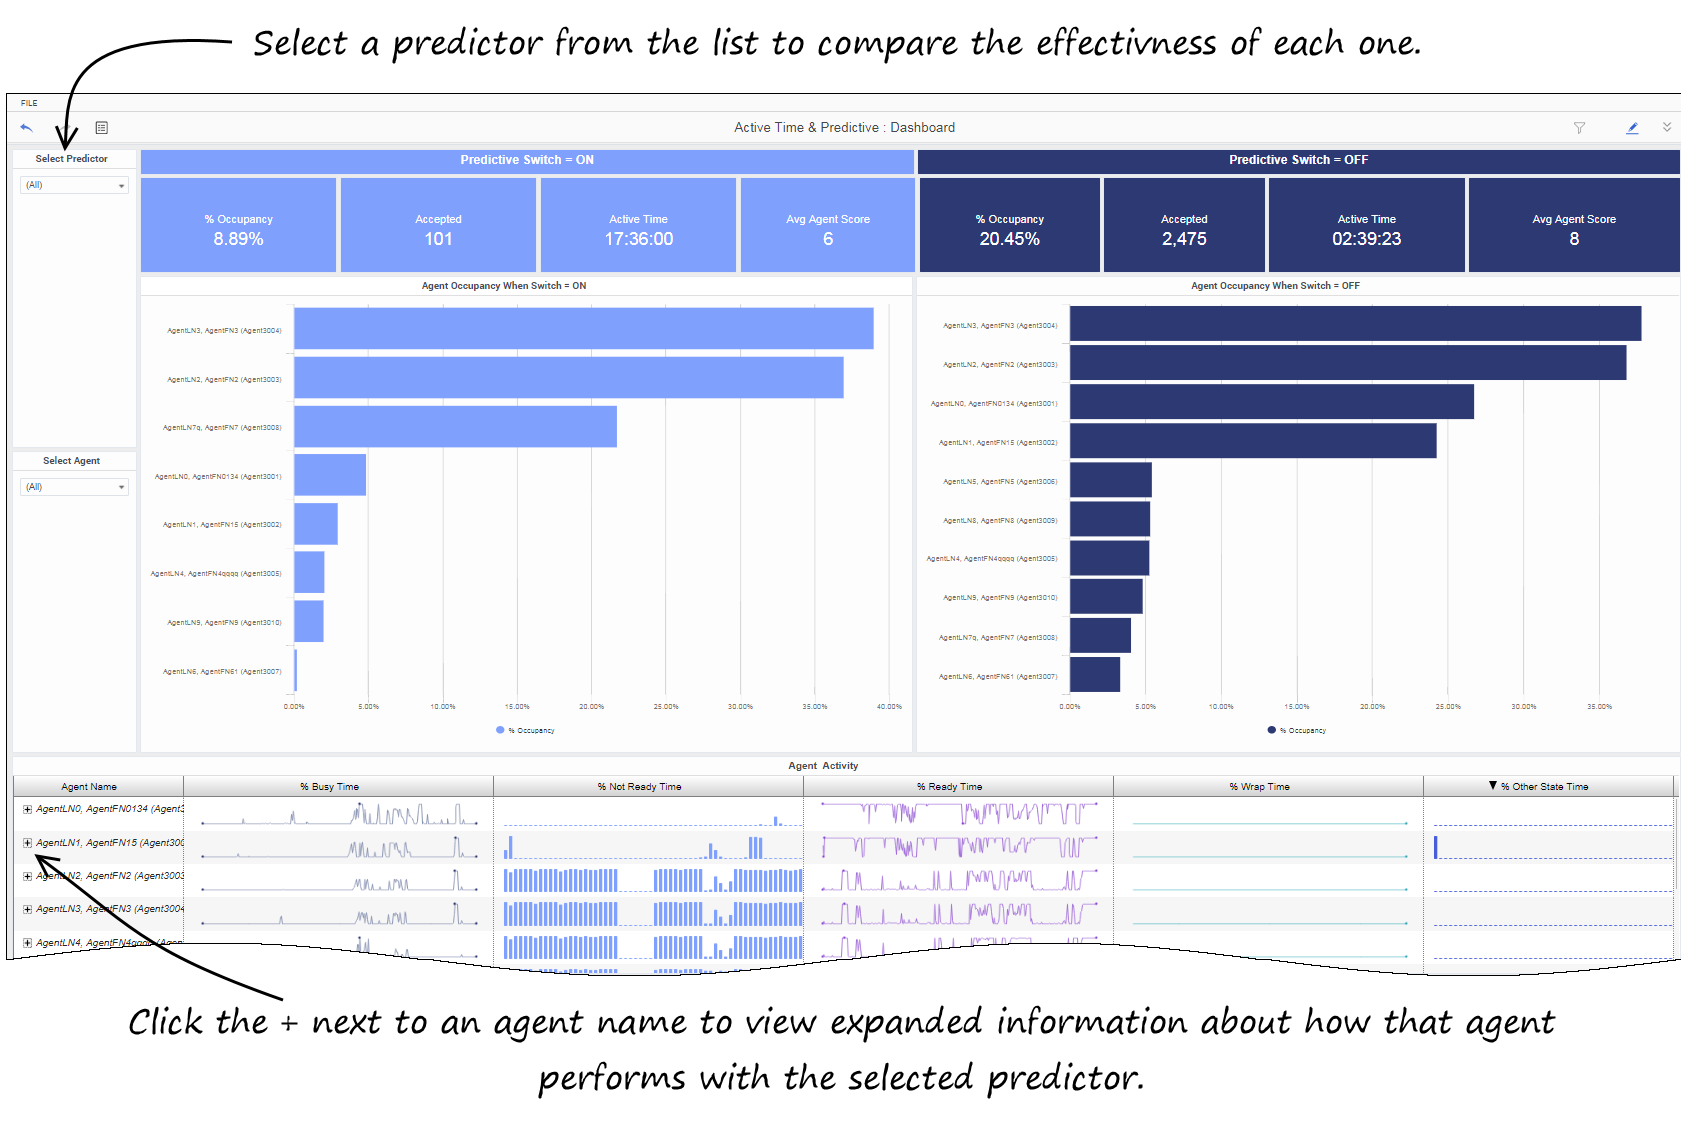
- Active Time and Predictive — Provides an interactive visual overview of Active Agent Time with and without Predictive Routing. The metrics displayed at the top of the dashboard can help you understand how GPR impacts your contact center: compare the values on the left (GPR on) to those on the right (GRP off), and select various predictors from the list on the left, to see the performance of each.
- At the bottom of the dashboard, you can also see detailed information about agents — these metrics are not impacted by GPR. Click the + next to an agent name to see detailed information for that agent.
- Details: Active Time and Predictive — Provides a grid where you can view detailed Active Time data, and organize it by various attributes, to better understand how Predictive Routing impacts each tenant, media type, and agent.
- Details: Interaction Time — Provides a grid where you can view a variety of metrics describing interaction time, to learn how Predictive Routing impacts each one.
- You can organize the grid based on various attributes, to better understand how Predictive Routing impacts each tenant, media type, and agent.
Prompts
The following table explains the prompts you can select when you generate the Predictive Routing Agent Occupancy Dashboard:
| Prompt | Description |
|---|---|
| Pre-set Day Filter | Choose a date from the list of preset options. If this prompt is set to anything other than none, the Report Date prompt is ignored. |
| Report Date | Select the day for which to generate a report. |
| Agent | Optionally, restrict the report to show information about specific agents. |
| Agent Group | Optionally, restrict the report to show information about specific groups. |
| Media Type | Optionally, restrict the report to show information about specific media types. |
| Interaction Type | Optionally, restrict the report to show information about specific interaction types. |
| Model | Optionally, restrict the report to show information about specific prediction models. |
| Predictor | Optionally, restrict the report to show information about specific predictors. |
| Tenant | Optionally, restrict the report to show information about specific tenants. |
Attributes and metrics on the Active Time & Predictive tab
The following table explains the attributes used on the Active Time & Predictive tab:
| Attribute | Description |
|---|---|
| Predictor | Enables the organization of data based on what predictor was used. |
| Agent | Enables the organization of data by agent. |
The following table explain the metrics used on the Active Time & Predictive tab:
| Metric | Description |
|---|---|
| % Occupancy | The percentage of time within the reporting interval that this agent’s state was Busy, relative to the total duration within the interval of the agent’s active session on a particular media channel. This metric reflects the percentage of time that agents actually spent handling interactions against their available or idle time. This metric is computed as (active time minus ready and not-ready time) divided by (active time minus not-ready time). |
| Accepted | The total number of times, within the reporting interval, that customer interactions and warm consultations were accepted, answered, or pulled by an agent, voice-treatment port, IVR port, or nonagent-associated DN (such as contact center resources that can alert). |
| Active Time | The total amount of time attributable to the interval between the beginning and end of this agent’s login session(s) on a particular media channel. |
| % Busy Time | The percentage of time spent by agent on interaction processing activities during a day (login-logout). |
| % Not Ready Time | The percentage of time within the interval that this agent’s state was in the NotReady state. |
| % Ready Time | The percentage of time within the interval that this agent’s state was in the Ready state. |
| % Wrap Time | The percentage of time that this agent spent in ACW. |
| % Other State Time | The percentage of the agent's time spent in a state other than those listed in the report. |
Attributes and metrics on the Details: Active Time & Predictive tab
The following table explains the attributes used on the Details: Active Time & Predictive tab:
| Attribute | Description |
|---|---|
| Tenant | Enables the organization of data by tenant. |
| Media Type | Enables the organization of data by media type. |
| Agent Name | Enables the organization of data by agent. |
| Hour | Enables the organization of data based on the day/date on which the interaction occurred. |
| Predictor Switch | Enables the organization of data based on whether predictive routing is ON or OFF. |
| Predictor | Enables the organization of data based on what predictor was used. |
| Model | Enables the organization of data based on what model was used. |
The following table explain the metrics used on the Details: Active Time & Predictive tab:
| Metric | Description |
|---|---|
| Offered | The total number of interactions that entered this queue and were subsequently offered to a resource within the reporting interval. |
| Accepted | The total number of times, within the reporting interval, that customer interactions and warm consultations were accepted, answered, or pulled by an agent, voice-treatment port, IVR port, or nonagent-associated DN (such as contact center resources that can alert). |
| % Occupancy | The percentage of time within the reporting interval that this agent’s state was Busy, relative to the total duration within the interval of the agent’s active session on a particular media channel.
This metric reflects the percentage of time that agents actually spent handling interactions against their available or idle time. This metric is computed as (active time minus ready and not-ready time) divided by (active time minus not-ready time). |
| Active Time (Fmt) | The total amount of time (HH:MM:SS) attributable to the interval between the beginning and end of this agent’s login session(s) on a particular media channel. In the scenario in which an agent logs into multiple switches, DNs, and/or queues, this metric starts the moment at which the agent logs in to the first switch/DN/queue (if this login falls within the interval) and ends at the moment at which the agent is no longer logged in to any switch/DN/queue (if logout falls within the interval). |
| Avg Agent Score | The sum of all Agent Scores (gpmAgentScore), divided by the total number of interactions where GPR was active. |
Attributes and metrics on the Details:Interaction Time tab
The following table explains the attributes used on the Details: Interaction Time tab:
| Attribute | Description |
|---|---|
| Tenant | Enables the organization of data by tenant. |
| Media Type | Enables the organization of data by media type. |
| Agent Name | Enables the organization of data by agent. |
| Hour | Enables the organization of data based on the day/date on which the interaction occurred. |
The following table explain the metrics used on the Details: Interaction Time tab:
| Metric | Description |
|---|---|
| Active Time (Fmt) | The total amount of time (HH:MM:SS) attributable to the interval between the beginning and end of this agent’s login session(s) on a particular media channel. In the scenario in which an agent logs into multiple switches, DNs, and/or queues, this metric starts the moment at which the agent logs in to the first switch/DN/queue (if this login falls within the interval) and ends at the moment at which the agent is no longer logged in to any switch/DN/queue (if logout falls within the interval). |
| Ready Time (Fmt) | The total amount of time (HH:MM:SS) that this agent was in the Ready state for a particular media channel. |
| Not Ready Time (Fmt) | The total amount of time (HH:MM:SS) within the interval that this agent was in the NotReady state for a particular media channel. |
| Wrap Time (Fmt) | The total amount of time (HH:MM:SS) within the interval that this agent spent in ACW. |
| Other State Time (Fmt) | The total amount of time (HH:MM:SS) that the state of this agent was neither Ready nor NotReady after login to a particular media channel. |
| % Ready Time | The percentage of time within the interval that agents were in the Ready state, divided by the total duration, within the interval, of active agent sessions. |
| % Not Ready Time | The percentage of time within the interval that agents were in the Ready state, divided by the total duration, within the interval, of active agent sessions. |
| % Busy Time | The percentage of time spent by agent on interaction processing activities during a day (login-logout). |
| % Wrap Time | The percentage of time that this agent spent in ACW. |
| % Other State Time | The percentage of the agent's time spent in a state other than those listed in the report. |
| %Busy Time | The percentage of time agents spent on interaction-processing activities including the time that is associated with requests for consultation that the agent received and excluding the time spent processing after-call work (ACW). |
| % Occupancy | The percentage of time within the reporting interval that this agent’s state was Busy, relative to the total duration within the interval of the agent’s active session on a particular media channel. This metric reflects the percentage of time that agents actually spent handling interactions against their available or idle time. This metric is computed as (active time minus ready and not-ready time) divided by (active time minus not-ready time). |
| Busy Time (Fmt) | The total duration (HH:MM:SS) of all of interaction processing activities including the time that is associated with requests for consultation that the agent received and excluding the time spent processing after-call work (ACW). |


