Predictive Routing - Model Efficiency Dashboard
Contents
Evaluate the impact that enabling various GPR prediction models has on your contact center efficiency.
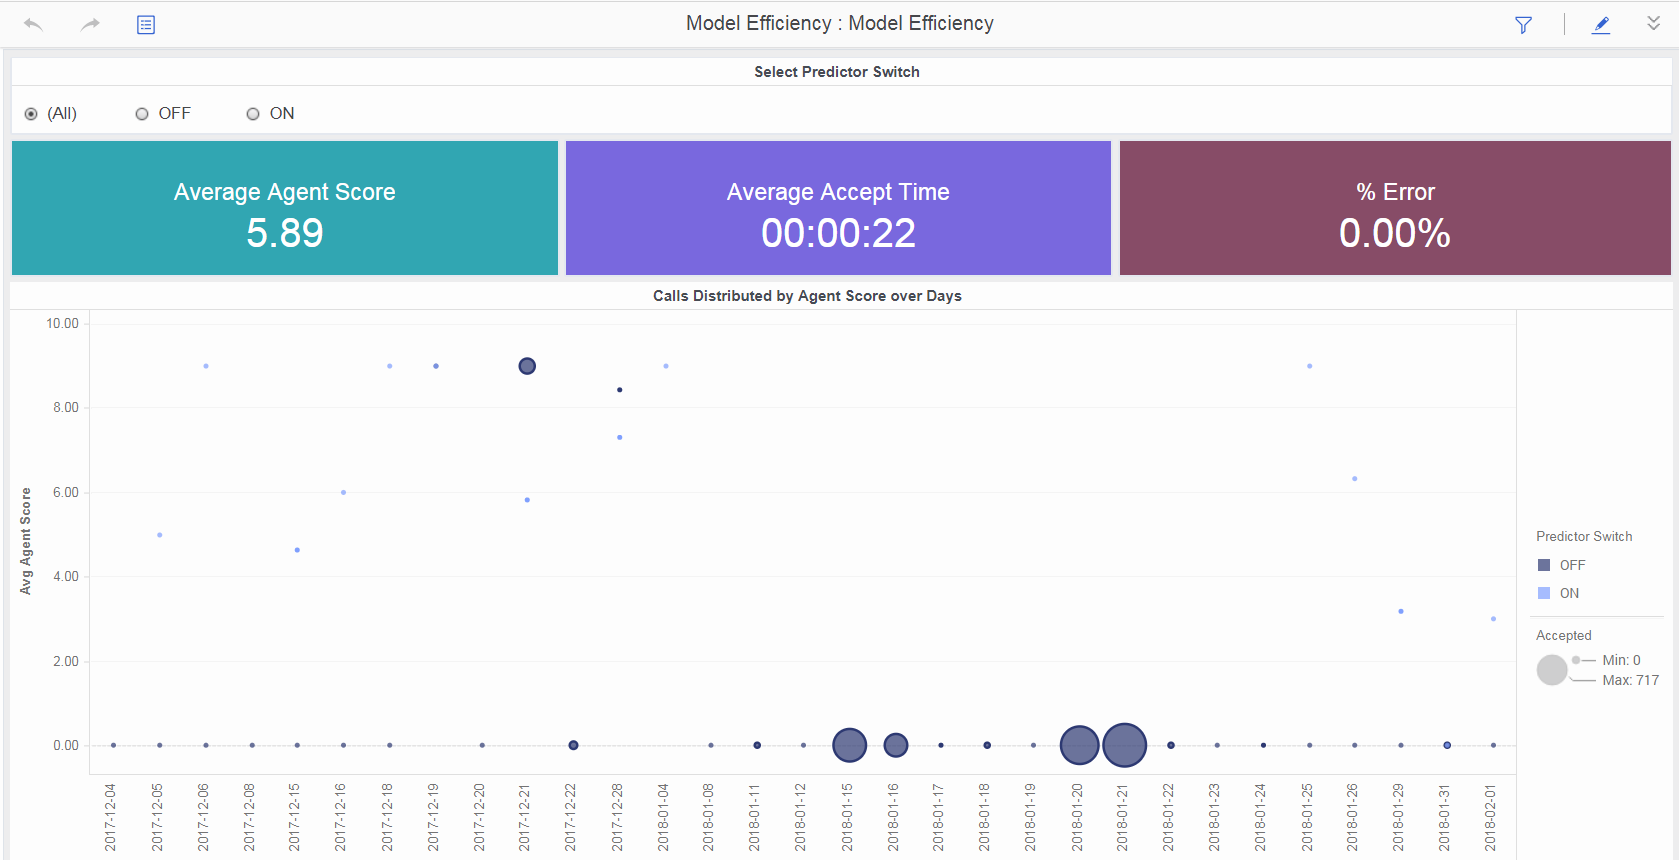
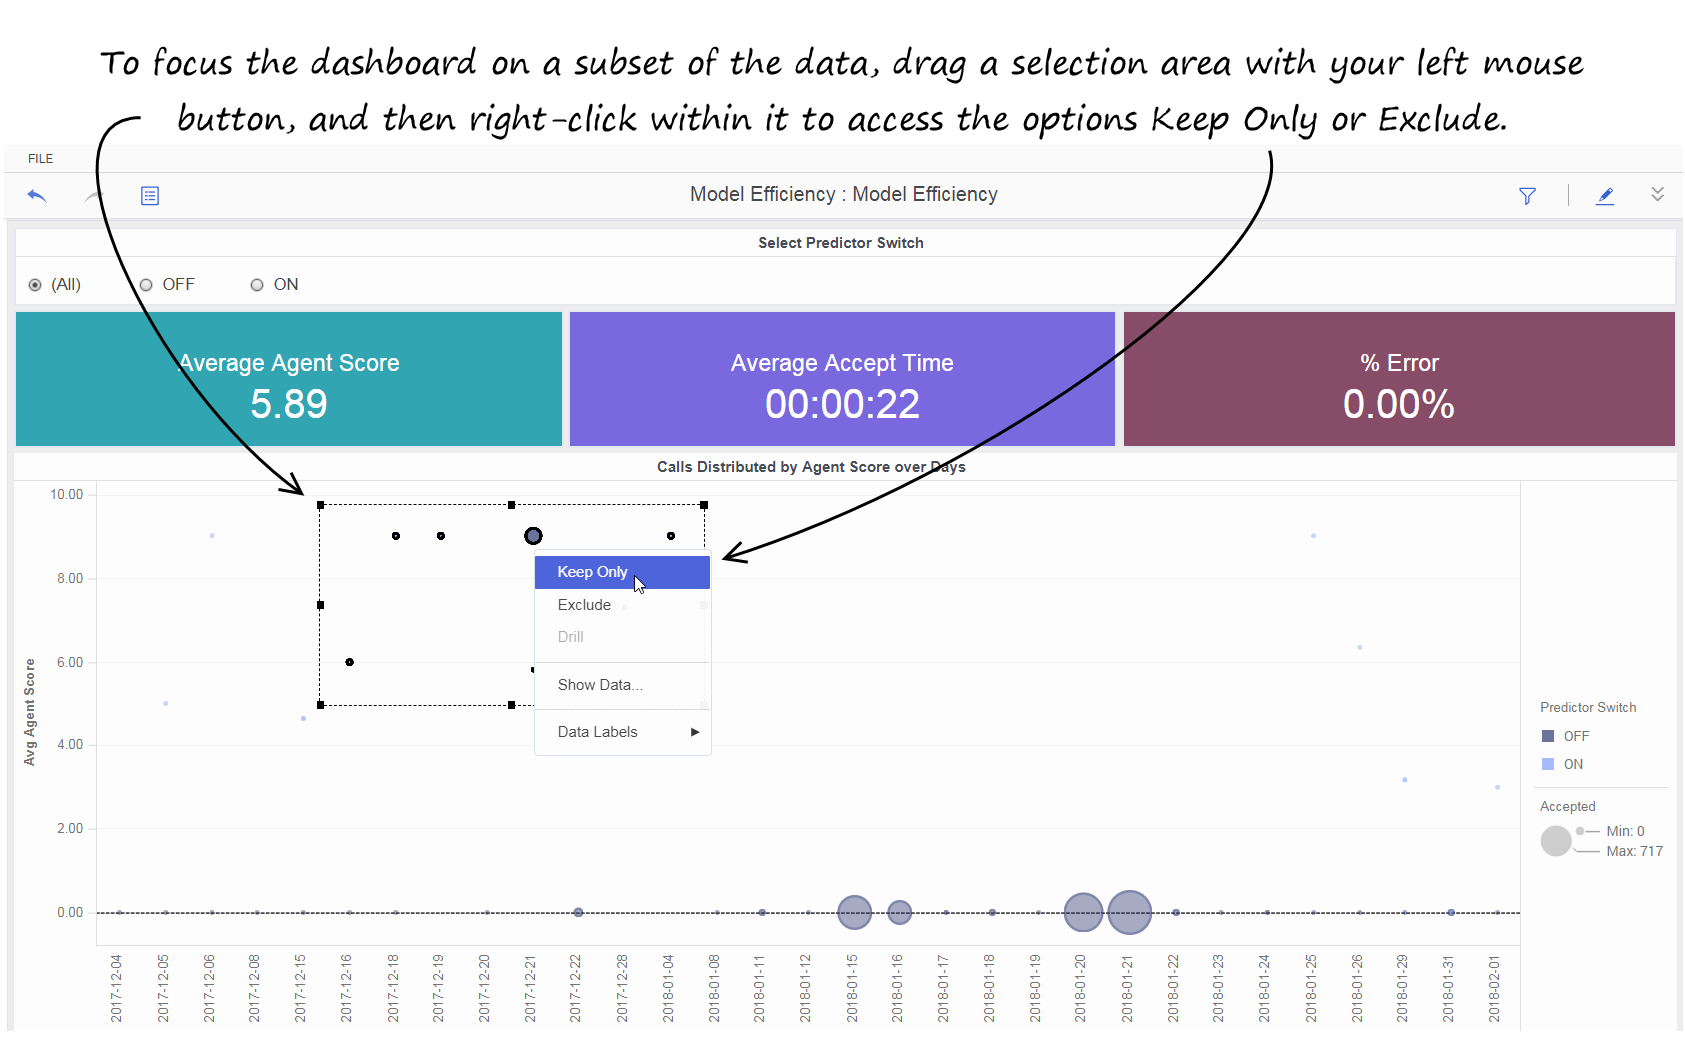
The (Predictive Routing folder) Predictive Routing — Model Efficiency Dashboard provides a bubble-graph summary that you can use to evaluate the impact on contact center efficiency of enabling GPR, and compare the effectiveness of various GPR prediction models. The dashboard includes graphical summaries of average agent scores, average time interactions waited in queue before being scored by Predictive Routing and distributed, and the percentage of interactions that encountered an error during Predictive Routing.
To get a better idea of what this dashboard looks like, view sample output from the report:Sample Predictive Routing — Model Efficiency Dashboard.pdf
Video: Introducing the Model Efficiency Dashboard
Understanding the Model Efficiency Dashboard
To help you understand the graph:
- The larger the bubble on the graph, the more calls were accepted.
- The color of the bubble indicates whether GPR was on or off.
- The higher the bubble is on the vertical axis, the higher the average agent score.
Prompts
The following table explains the prompts you can select when you generate the Predictive Routing - Model Efficiency Dashboard:
| Prompt | Description |
|---|---|
| Pre-set Date Filter | Choose a date from the list of preset options. If this prompt is set to anything other than none, the Report Date prompt is ignored. Default: Year-to-Date. |
| Start Date | Choose the first date on which to report. This prompt has no effect if Pre-set Date Filter is set to anything other than none. |
| End Date | Choose the last date on which to report. This prompt has no effect if Pre-set Date Filter is set to anything other than none. |
| Media Type | Select one or more media types for which to gather data into the report. |
| Predictor | Select one or more predictors to include in the report. |
| Model | Select one or more prediction models to include in the report. |
| Tenant | Select one or more tenants to include in the report. |
Attributes
The following table explains the attributes used on the Predictive Routing - Model Efficiency Dashboard:
| Attribute | Description |
|---|---|
| Day | Enables the organization of data based on the day/date on which the interaction occurred. |
| Predictor Switch | Enables the organization of data based on whether Predictive Routing is ON, OFF, or for which an error occurred. |
Metrics
The following table explains the metrics used on the Predictive Routing - Model Efficiency Dashboard:
| Metric | Description |
|---|---|
| % Error | Percentage of active interactions that received a Predictive Routing error score. |
| Accepted | Total number of calls accepted. |
| Avg Agent Score | The sum of all Agent Scores (gpmAgentScore), divided by the total number of interactions where GPR was active. |
| Average Accept Time | The average amount of time, in seconds, it took agents to accept, answer, or pull customer interactions. |


