ETL Audit Dashboard
Track job execution statistics, including duration, status, and other critical ETL values.
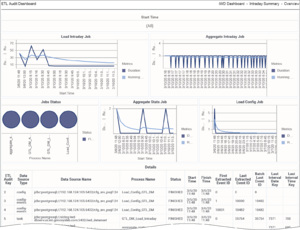
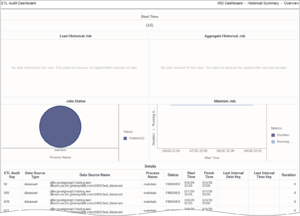
Use the (CX Insights for iWD folder >) ETL Audit Dashboard to efficiently audit/analyze iWD ETL processes. The dashboard provides an overview of job execution statistics, including duration, status, and other information drawn from the ETL_AUDIT table.
The dashboard report organizes data on the following tabs:
- Summary Intraday tab — Use this tab to analyze job execution statistics for intraday jobs, which are jobs that run on a regular interval (every 15 minutes by default, or at user-configurable interval).
- Summary Historical tab — Use this tab to analyze job execution statistics for historical jobs, which are jobs that run on a daily basis.
Note that the term dashboard is used interchangeably with the term dossier. Dashboards provide an interactive, intuitive data visualization, summarizing key business indicators (KPIs). You can change how you view the data in most reports and dashboards by using interactive features such as selectors, grouping, widgets, and visualizations, and explore data using multiple paths, through text and data filtering, and layers of organization.
To get a better idea of what this dashboard looks like, view sample output from the report:
SampleETLAuditDashboard.pdf
The following table explains the prompts you can select when you generate the ETL Audit Dashboard:
| Prompt | Description |
|---|---|
| Start Time Min | Choose the low filter value for the Start Time attribute. |
| Start Time Max | Choose the high filter value for the Start Time attribute. |
| Data Source Type | Optionally, select a data source type on which to focus the report. |
| Process Name | Optionally, select a business process on which to focus the report. |
| Status | Optionally, select a status on which to focus the report. |
The following table explains the attributes used in the ETL Audit Dashboard:
| Attribute | Description |
|---|---|
| ETL Audit Key | Enables data to be organized based on the technical key which identifies DataMart job. |
| Data Source Type | Enables data to be organized based on the type of data source. |
| Data Source Name | Enables data to be organized based on the name of the data source. |
| Process Name | Enables data to be organized based on the process name. |
| Status | Enables data to be organized based on job status. |
| Job Type | Enables data to be organized based on the the type of job. |
| Start Time | Enables data to be organized based on the time when the job started. |
| Finish Time | Enables data to be organized based on the time when the job finished. |
| Batch ID | Enables data to be organized based on the batch number. Applicable only to jobs that process data in batches. |
| First Extracted Event ID | Enables data to be organized based on the ID that starts the range of event IDs that are processed. |
| Last Extracted Event ID | Enables data to be organized based on the ID that ends the range of event IDs that are processed. |
| Batch Last Event ID | Enables data to be organized based on the lD of the last event in the batch. |
| Last Interval Date Key | Enables data to be organized based on the last date interval that is processed by the aggregate ETL scripts. |
| Last Interval Time Key | Enables data to be organized based on the last time interval that is processed by the aggregate ETL scripts. |
The following table explains the metrics used in the ETL Audit Dashboard:
| Metric | Description |
|---|---|
| Duration | The total amount number of seconds that job execution lasted. This value is calculated based on the creation timestamp for the job during the given time interval (ETL_AUDIT_START_TIME), and the finish time for the job (ETL_AUDIT_FINISH_TIME). |
| Extracted Events Amount | The number of loaded events during a job or batch run. |
To view more detailed information about the metrics and attributes in this report, and other metrics and attributes that can be used to customize reports, see the Genesys CX Insights Multicloud Projects Reference Guide.


