Customize reports
Contents
Modify out-of-box reports to customize them for your business needs.
Information on this page applies to both reports and dashboards, but for simplicity, refers to them simply as reports.
The out-of-box historical reports are flexible enough for most business needs. However, Genesys CX Insights is highly customizable, allowing you to create customized reports, or modify copies of the out-of-box reports (you can save your reports in the Custom or My Reports folders). Genesys does not support customization of the underlying metadata.
Modifying reports can be an involved process, and is recommended for advanced users only. For help, contact Genesys.
Video: Creating and editing reports
Creating and editing reports
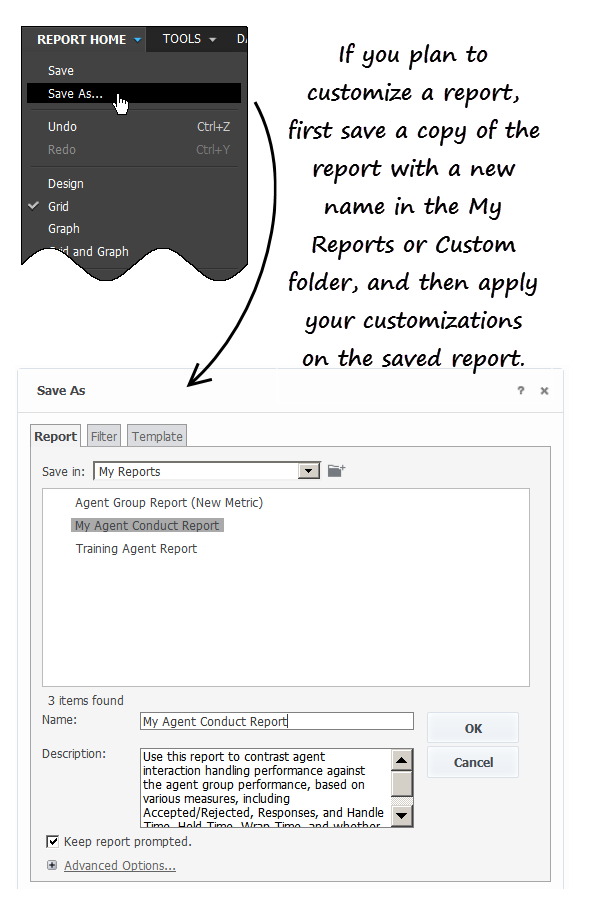
The easiest way to create a new report is to save a copy of an existing report to edit. Begin by browsing through the reports that are provided out-of-box, and select the one that most closely resembles what you'd like to create.
- Log in with an account having Administrator privileges.
- Open and run the report you want to modify.
- In the Save As editor:
- Click Report Home > Save As.
- In the Save in field, choose either: Shared Reports > Custom — to make the new report accessible to other users, or My Reports — to make the new report accessible only to you.
- Enter a Name for the report, and optionally modify the Description, or Advanced Options.
- Click OK.
- In the Report Saved editor, click Run newly saved report.
- The prompts page opens; make appropriate selections and click Run Report. You can now modify the report.
- In the menu, click Grid > Design to view the Report Objects Editor (if it's not already visible).
- Once you have finished editing the report, click Save.
For information about additional metrics and attributes you can use in reports, see the Genesys CX Insights Projects Reference Guide.
Blending data from other sources
Genesys CX Insights supports data blending from uploaded files. Using MicroStrategy Web, you can import data from Excel or CSV files, and use it to create reports or dashboards. Note that data blending requires advanced knowledge, specific account privileges, and an environment configured to support data import. Talk to your administrator about enabling this functionality for your use.
Avoiding and troubleshooting incompatibility
It is possible for your custom reports to generate results that are difficult to interpret, to generate errors, or to require excessively long query-processing times when certain combinations of metrics and attributes are included in the report. This can happen for various reasons, such as:
- Improperly combining incompatible attributes—such as the Queue and State Name attributes—in the same report.
- Improperly combining disposition and interval metrics in the same report.
For this reason, Genesys recommends that when you create or customize new reports, observe the following rules, to minimize problems:
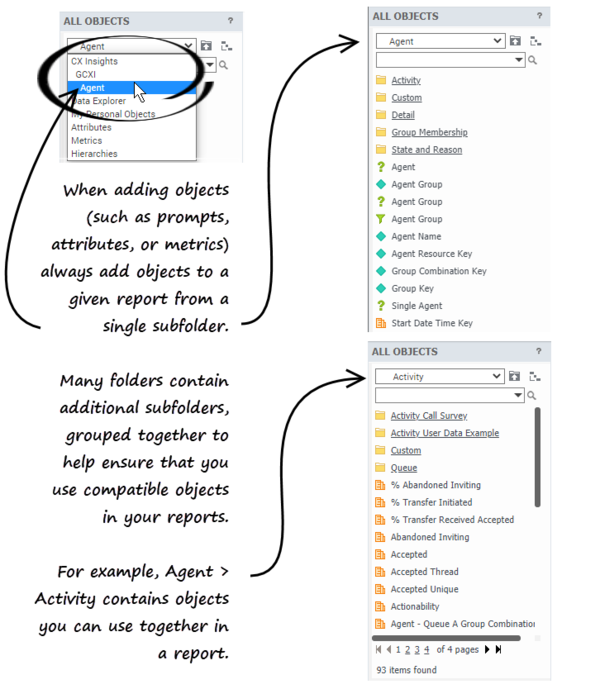
- In any report, employ metrics and attributes from a single subfolder.
- Select one or more Time attribute in every report.
Finally, as is the case with any report design, study the SQL expressions of your generated custom report to ensure that the MicroStrategy engine joins data in the correct way, and that the returned data makes sense.
Double-counting
Interactions pertaining to an object are attributed to each group of which the object is a member. So, in scenarios where an agent is a member of more than one Agent Group, interactions are counted against each group, and can therefore appear more than once in historical reports. The same holds true for Queues that are members of more than one Queue Group; interactions that are attributed to such a queue are reported against both queue groups. This can cause unexpected results in your custom reports.
Incompatible Objects
Incompatibilities can occur if you build a report using metrics and attributes from mismatched folders.
To avoid Incompatibility problems, Genesys strongly recommends that you add objects (prompts, attributes, and metrics) from a given subfolder within the GCXI folder. Each subfolder contains a set of attributes and metrics that are designed to work together. Never mix in objects from another folder — even though they may have the same name, they are not compatible.
For example, if you are creating a report that based on the Agent Utilization Report, but you'd want the report to also track the total amount of time attributed to call handling during the reporting interval, you'd open the report for editing, and from the Agents; folder, drag the Total Handle Time metric into the report. You must not use a same-named metric from another folder, since the report is built on Agents metrics and attributes.
Metric types
Metrics are classified as one of three data types:
- Detail
- Interval
- Disposition
Metrics can also be described as measuring either customer or consult interactions, and for consult interactions, as either warm or simple consultations. Objects are sometimes divided into subfolders that reflect this, as shown in the figure The Queue hierarchy.
Detail Metrics
Detail metrics provide the measure of one (and only one) activity, in contrast to interval and disposition metrics, which aggregate information about a number of interactions that occur over a period of time. Some examples of detail metrics include:
- Agent > Detail > Session > Active Time
- Agent > Detail > State > Reason Time
- Agent > Detail > Ixn State > Duration
- Detail > Handling Attempt > Queue Time.
Interval Metrics
Interval metrics measure the activities occurring within the reporting interval as they occur, regardless of whether or not the interactions complete during the interval and whether or not the interval completes.
Counts and durations of such metrics are clipped where interactions cross over multiple intervals and are attributed to each of the intervals in which the activities occur. In scenarios in which an interaction is waiting in queue when the hour changes, the time that the interaction actually waited in queue during the first interval is attributed to the first interval. For example, if an interaction is waiting in queue from 3:58–4:03 PM, two minutes is attributed to the first interval (3:30–3:59 PM), and the remaining three minutes is attributed to the second interval (4:00–4:29 PM).
Furthermore, a count is attributed to each interval in which the interaction persists—that is, a count of 1 for the interaction that is waiting in queue during the first interval, and another count of 1 for the same interaction, waiting in queue, during the second interval.
Some examples of interval metrics include:
- Agent > State and Reason > Interaction State > Consult Received Time
- Agent > State and Reason > Interaction State > Hold
- Agent > State and Reason > Summarized State > Active Time
- Agent > State and Reason > Interaction State > Hold
- Agent > State and Reason > Summarized State > Busy
Disposition Metrics
Disposition metrics provide an interpretation of the count and duration of contact center activity, attributing their metric to the interval in which an interaction was received by the contact-center resource—whether the resource is a mediation DN or a handling resource, such as an agent. In scenarios in which an agent talks to a customer over day boundaries, all of the talk time is attributed to the first reporting interval and no time is attributed to the latter interval. For example, if an agent talks to a customer over day boundaries (11:45 PM –12:15 AM), all of the talk time (30 minutes) is attributed to the first reporting interval (Day 1) and no time is attributed to the latter interval(s) (Day 2).
Likewise, the count (of 1 interaction) gets attributed to the first interval; no count at all gets attributed to the second. As such, disposition metrics are additive; their counts from one interval can be added to the counts of other intervals to obtain a total count of activity across all intervals, without double counting.
Some examples of interval metrics include:
- Agent > Activity > Avg Consult Received Time
- Business Attribute > BA Customer > % Transfer Initiated Agent
- Queue > Q Customer > % Transfer Initiated Agent
Related Topics
Advanced users can learn more about creating and customizing reports by accessing MicroStrategy documentation (MicroStrategy is the underlying engine that drives Genesys CX Insights). Log in to Genesys CX Insights, click the menu next to your user name, and click Help to access the latest online MicroStrategy user guides and manuals, or go straight to the MicroStrategy Community Search Page and enter your search terms there.
- View a complete list of available reports.
- Learn how to generate historical reports.
- Learn how to read and understand reports.
- Learn how to create or customize reports.
To view more detailed information about the metrics and attributes used in the reports, and about other metrics and attributes that you can use to customize reports, see the Genesys CX Insights Multicloud Projects Reference Guide.


