Dashboards
From Genesys Documentation
This topic is part of the manual Work with Genesys CX Insights Reports for version Current of Reporting.
Learn about dashboards, which provide visual summaries of activity in your contact center, and are organized to suit your role in the organization.
Related documentation:
RSS:
Dashboards (stored in the Dashboards folder) are ready-to-use, but as always, can be modified to suit your specific business needs.
About the Dashboards
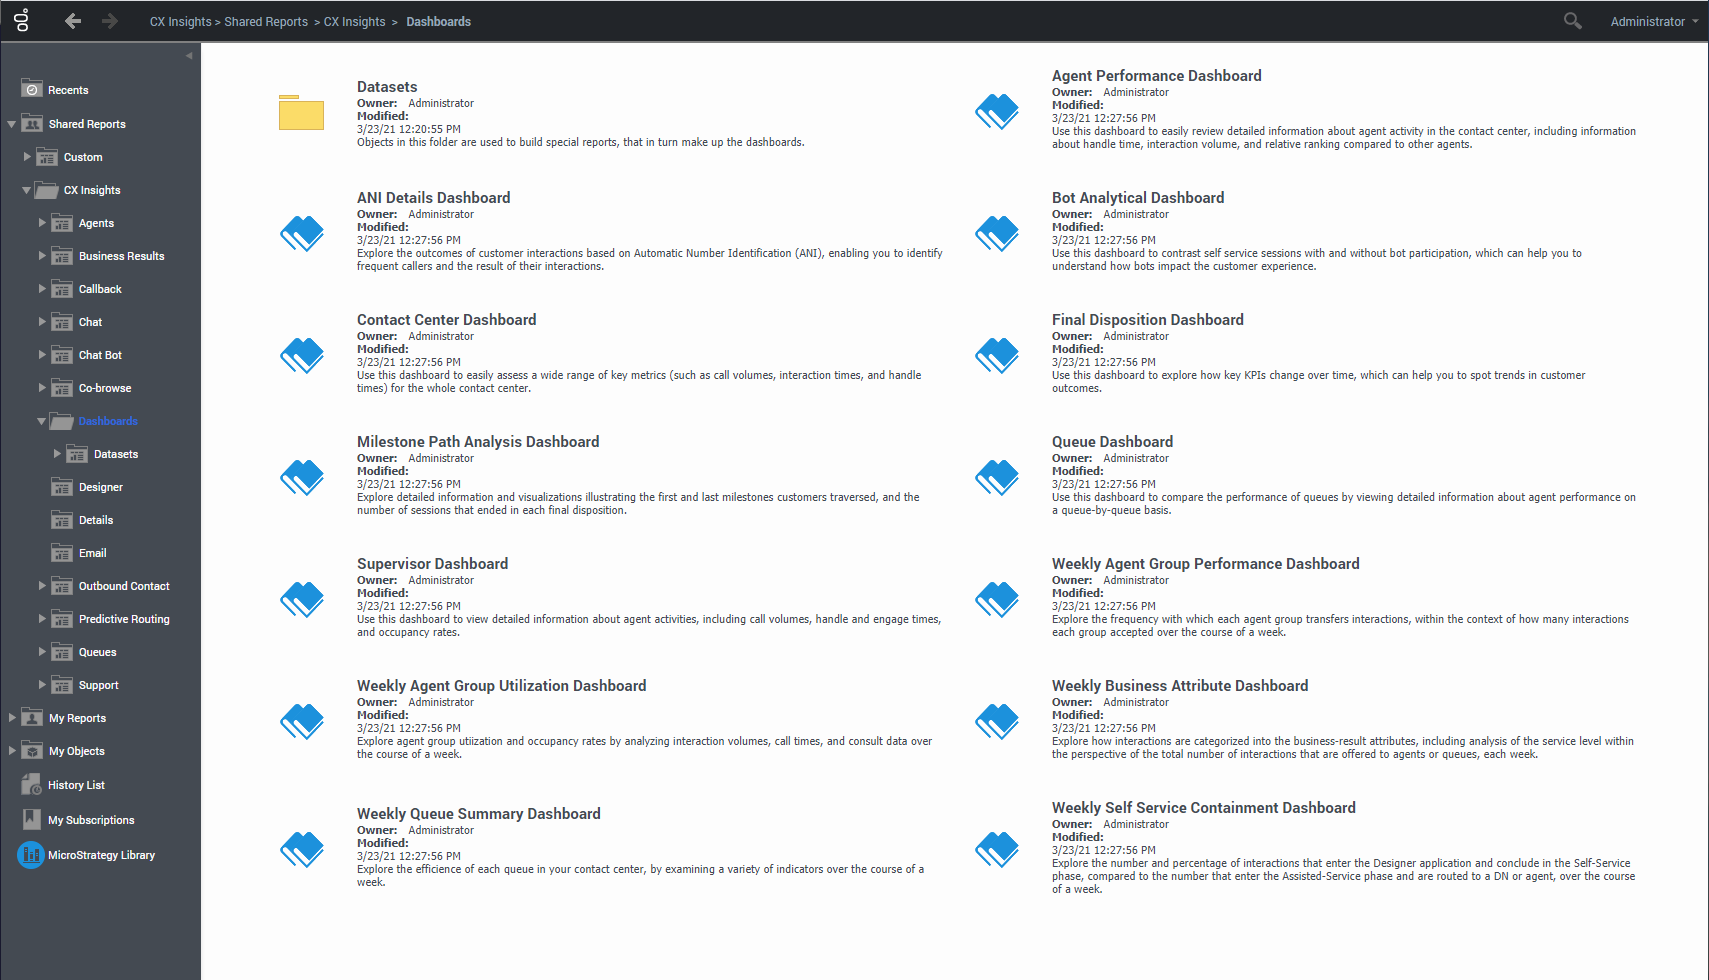
The following dashboards are available in the CX Insights > Dashboards folder:
- ANI Details Dashboard
- Agent Performance Dashboard
- Bot Analytical Dashboard
- Contact Center Dashboard
- Final Disposition Dashboard
- Milestone Path Analysis Dashboard
- Queue Dashboard
- Transfer Dashboard
- Supervisor Dashboard
- Weekly Agent Group Performance Dashboard
- Weekly Agent Group Utilization Dashboard
- Weekly Business Attribute Dashboard
- Weekly Queue Summary Dashboard
- Weekly Self Service Containment Dashboard
Plus dashboards in other folders, such as the following:
Video: Using Tabs and Views
Navigate through tabs and views on dashboards.
Related topics
- Go back to the complete list of available reports.
- Learn how to generate historical reports.
- Learn how to read and understand reports.
- Learn how to create or customize reports.
To view more detailed information about the metrics and attributes used in the reports, and about other metrics and attributes that you can use to customize reports, see the Genesys CX Insights Multicloud Projects Reference Guide.
Comments or questions about this documentation? Contact us for support!

