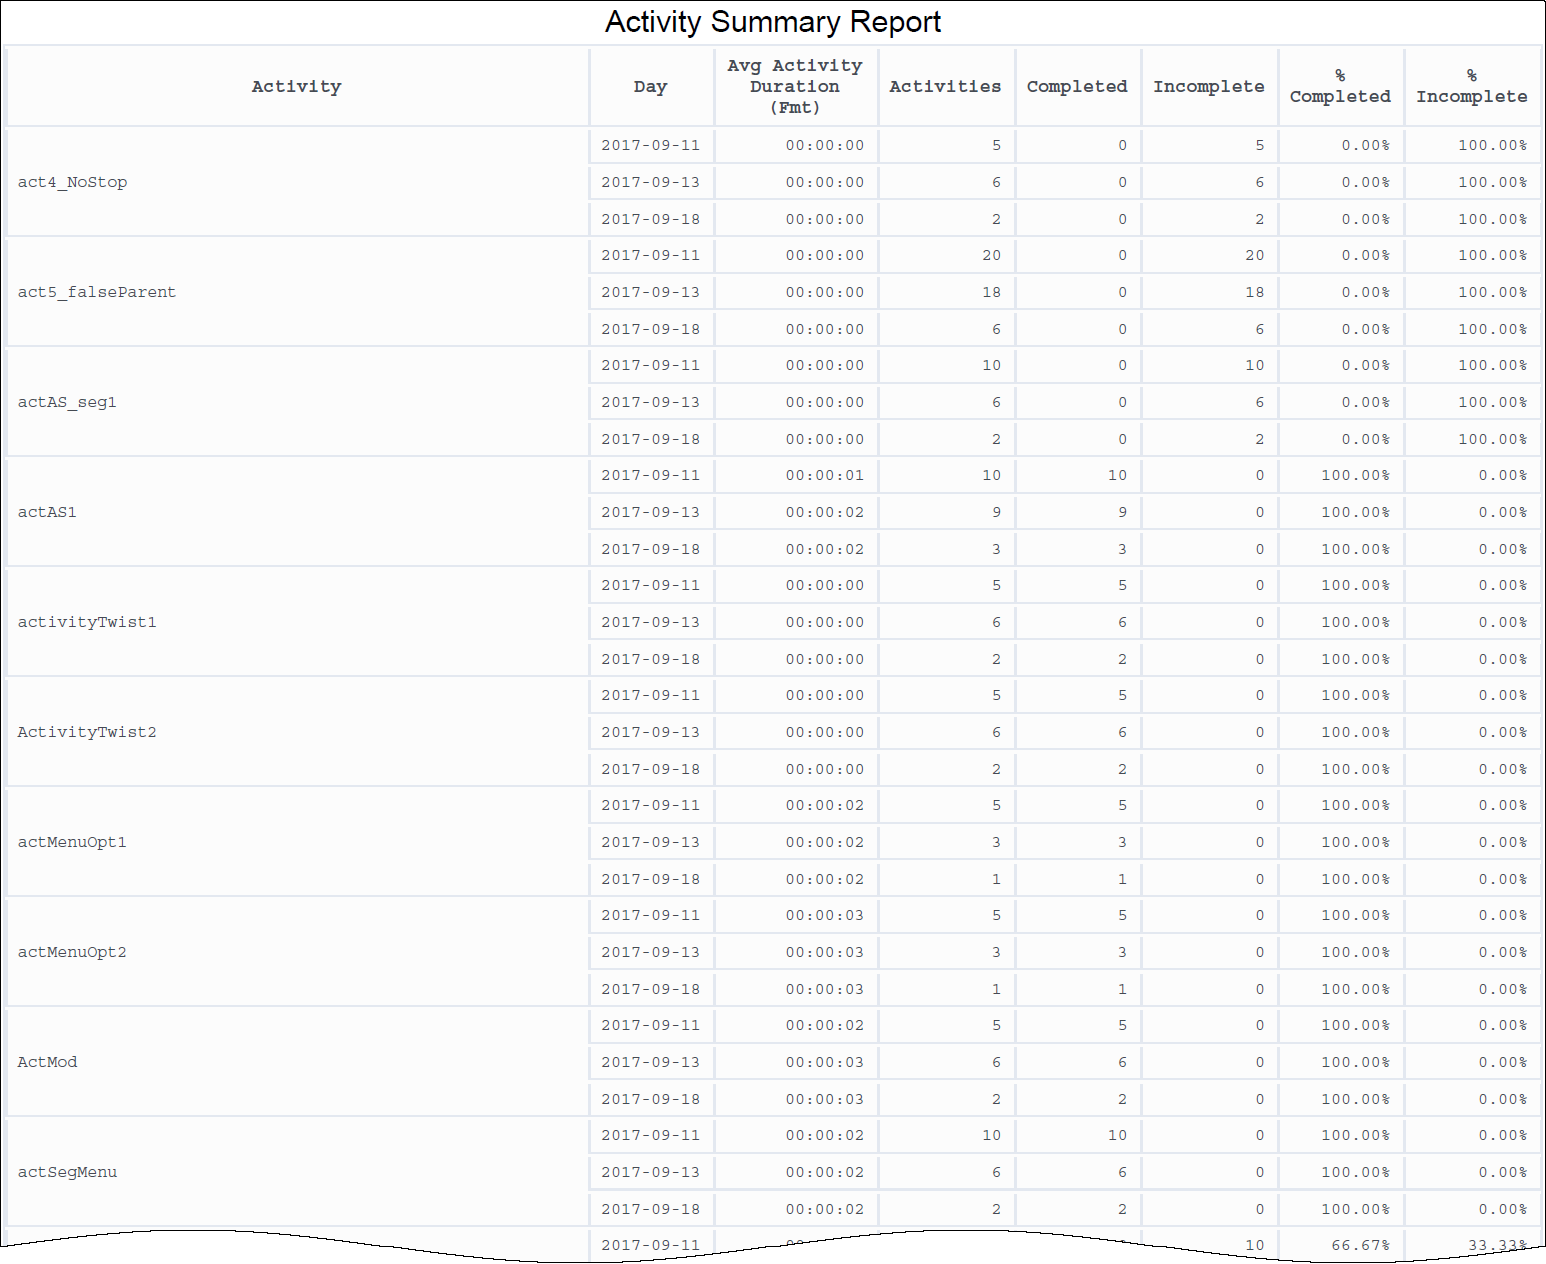
Activity Summary Report
Contents
View summary information about activities in Designer applications, including the number of activities within a given time period, and the number and percentage of those activities that were complete or incomplete.
Understanding the Activity Summary Report
This report provides information about Designer activities.
An activity is a task that you've defined in an application as a series of steps with a starting point and stopping point. For example, you might set up an activity for making a payment that starts with the caller being asked for their credit card details and then ends with the system sending those details to a payment processor and receiving the approval.
Each activity has a start and end point, and can be complete or incomplete, with success or failure.
To get a better idea of what this report looks like, view sample output from the report:
Prompts for the Activity Summary Report
| Prompt | Description |
|---|---|
| Pre-set Date Filter | From the list, choose a time period on which to report, and move it to the Selected list. |
| Start Date | Choose the first day from which to gather data into the report. |
| End Date | Choose the last day from which to gather data into the report. |
| Application | Choose the applications on which to report. By default, the report includes all applications; if you add any applications to the Selected list, then only those applications are included. |
| Activity | Choose the activities on which to report. By default, the report includes all activities. |
Attributes used in the Activity Summary Report
| Attribute | Description |
|---|---|
| Activity | This attribute enables data within the reporting interval to be organized by the name of the activity. |
| Day | This attribute enables data within the reporting interval to be organized by a particular day. |
Metrics used in the Activity Summary Report
| Metric | Description |
|---|---|
| Avg Activity Duration (Fmt) | The average amount of time attributed to each activity. |
| Activities | The total number of activities that began during the reporting interval. |
| Completed | The total number of activities that were completed during the reporting interval. |
| Incomplete | The total number of activities that started during the reporting interval, but were not completed. |
| % Completed | The percentage of activities that were completed during the reporting interval. |
| % Incomplete | The percentage of activities that were incomplete at the end of the reporting interval. |
To view more detailed information about the metrics and attributes in this report, and other metrics and attributes that can be used to customize reports, see the Genesys CX Insights Projects Reference Guide.

