Difference between revisions of "DES/Current/Designer/Troubleshooting"
(Published) |
m (Text replacement - "\|Platforms?=([^\|]*)PureEngage([\|]*)" to "|Platform=$1GenesysEngage-onpremises$2") |
||
| Line 5: | Line 5: | ||
|Context=This page describes how to generate network logs from different types of browsers. If you are experiencing issues with Designer, this information can be used to assist with troubleshooting. | |Context=This page describes how to generate network logs from different types of browsers. If you are experiencing issues with Designer, this information can be used to assist with troubleshooting. | ||
|ComingSoon=No | |ComingSoon=No | ||
| − | |Platform= | + | |Platform=GenesysEngage-onpremises |
|Prereq= | |Prereq= | ||
|Section={{Section | |Section={{Section | ||
Revision as of 11:45, July 15, 2020
Contents
This page describes how to generate network logs from different types of browsers. If you are experiencing issues with Designer, this information can be used to assist with troubleshooting.
How to check your Designer version
How to capture a network log
Most browsers allow you to capture an HTTP Archive (HAR) file, which contains details about how a particular web page has been handled by the browser. If you are asked to provide a HAR file to Genesys, follow the steps for your browser.
How to generate a HAR file using Chrome
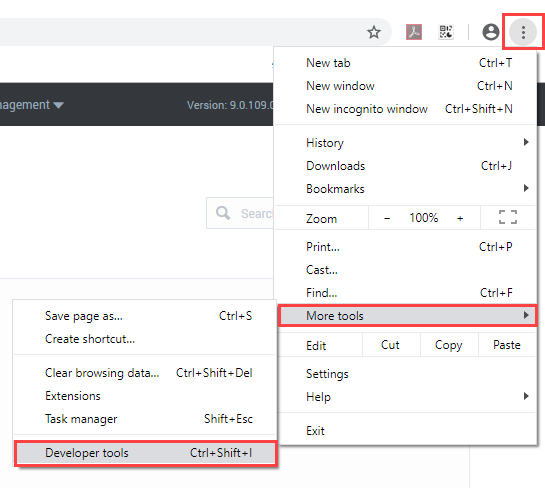
To start, go to the Designer page where you are experiencing the issue. From the Chrome settings menu, go to More tools > Developer tools to launch the developer tools console.
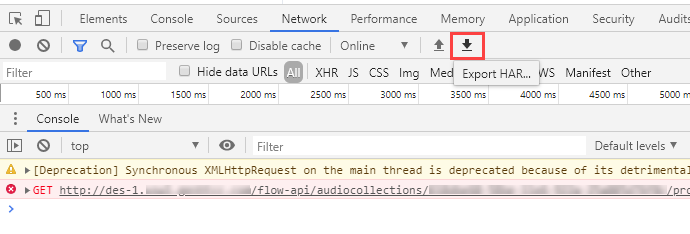
In the developer tools console, go to the Network tab and select Preserve log. Once you click the box, the red circle on the left indicates that the network activity is now being captured. (If the circle is still black, you can click it to toggle capturing on.)
While the capture is running, refresh the page and try to reproduce the issue you are having with the Designer page. When you are finished, you can stop the capture by deselecting the Preserve log box, or by clicking the red circle.
Click the Export HAR button to download the file to your computer.
How to generate a HAR file using Firefox
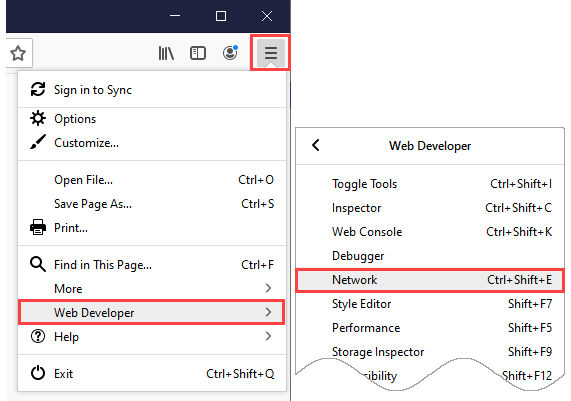
Go to the Designer page where you are experiencing the issue. From the Firefox settings menu, click Web Developer and select Network to launch the developer console.
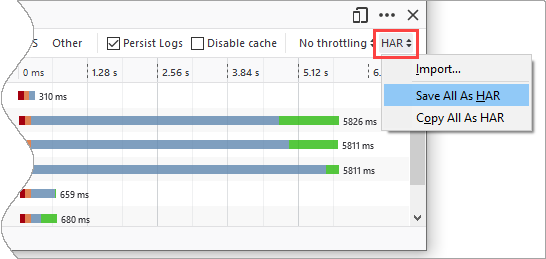
In the developer console, go to the Network tab and select Persist Logs.
Refresh the Designer page and/or perform the action that isn't working correctly. When you are finished, click the HAR button and select Save All As HAR to download the file to your computer.
How to generate a HAR file using Safari
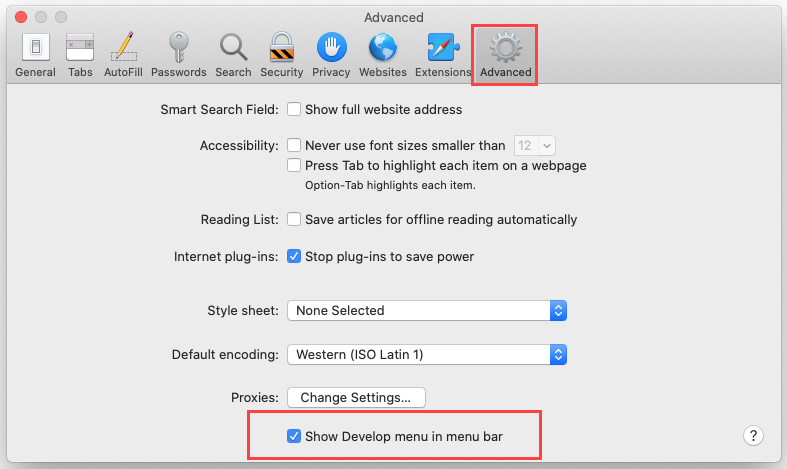
Go to the Designer page where you are experiencing the issue. From the Safari menu, select Preferences. Click the Advanced tab and enable the Show Develop menu in menu bar option.
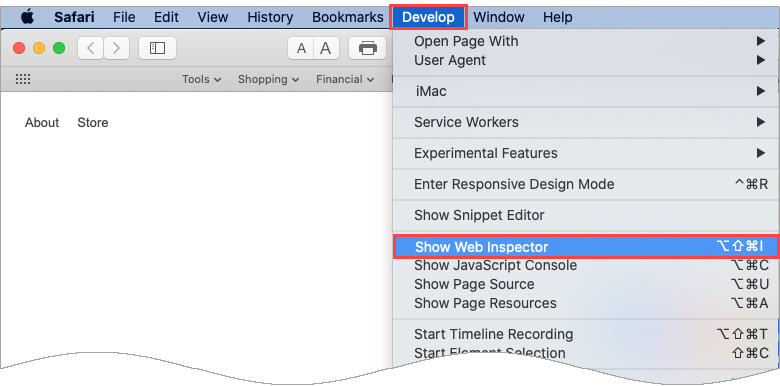
From the Develop menu, select Show Web Inspector.
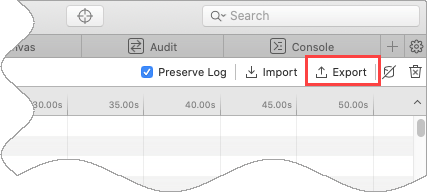
In the Web Inspector console, go to the Network tab and select Preserve Log.
Refresh the Designer page and/or perform the action that isn't working correctly. When you are finished, click the Export button to download the file to your computer.
How to generate a HAR file using Edge
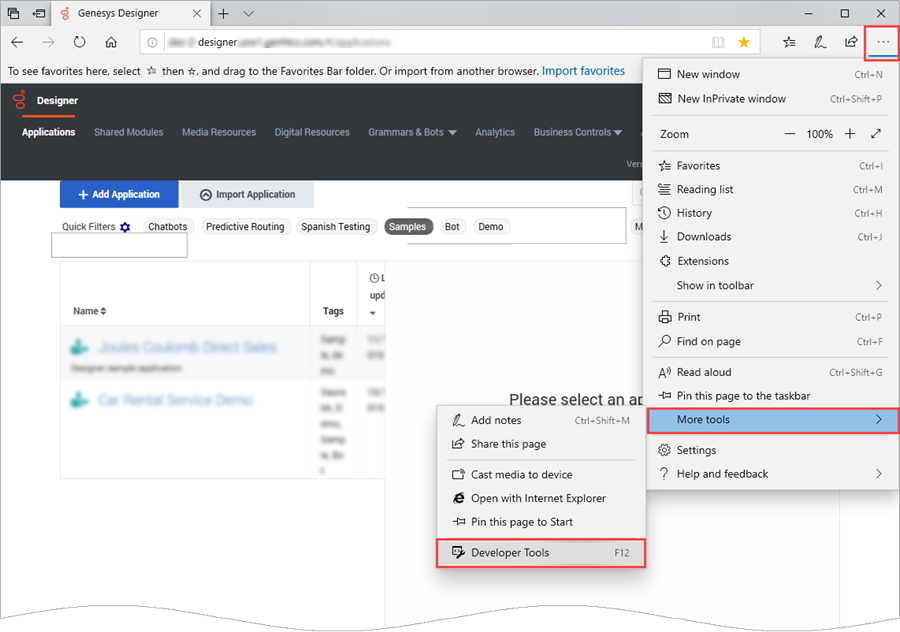
To start, go to the Designer page where you are experiencing the issue. From the Edge settings menu, go to More tools > Developer tools to launch the Developer Tools console.
In the Developer Tools console, go to the Network tab. You can toggle the capture on/off using the Play (triangle) and Record (square) buttons. If the record button is not red (i.e. active), click it to start capturing data.
Refresh the Designer page and/or perform the action that isn't working correctly. When you are finished, click the Export HAR button to download the file to your computer.


