Agent and contact center statistics
Contents
Learn about the available agent and contact center statistics.
The Desktop Statistics section allows you to add, edit, import and export statistics to be displayed under My Reports and Contact Center panes of the Agent Desktop dashboard or the Reports view in Gplus Adapter. The Statistics tab includes three sub-tabs to help you manage your statistics:
Essentially, you add statistics to a global statistics list. Then from that list, you can select the statistics that you want to apply. Statistics can be re-used, meaning that if you create a statistic for a specific agent group, for example, you can then apply that favorite to another agent group.
Agent statistics
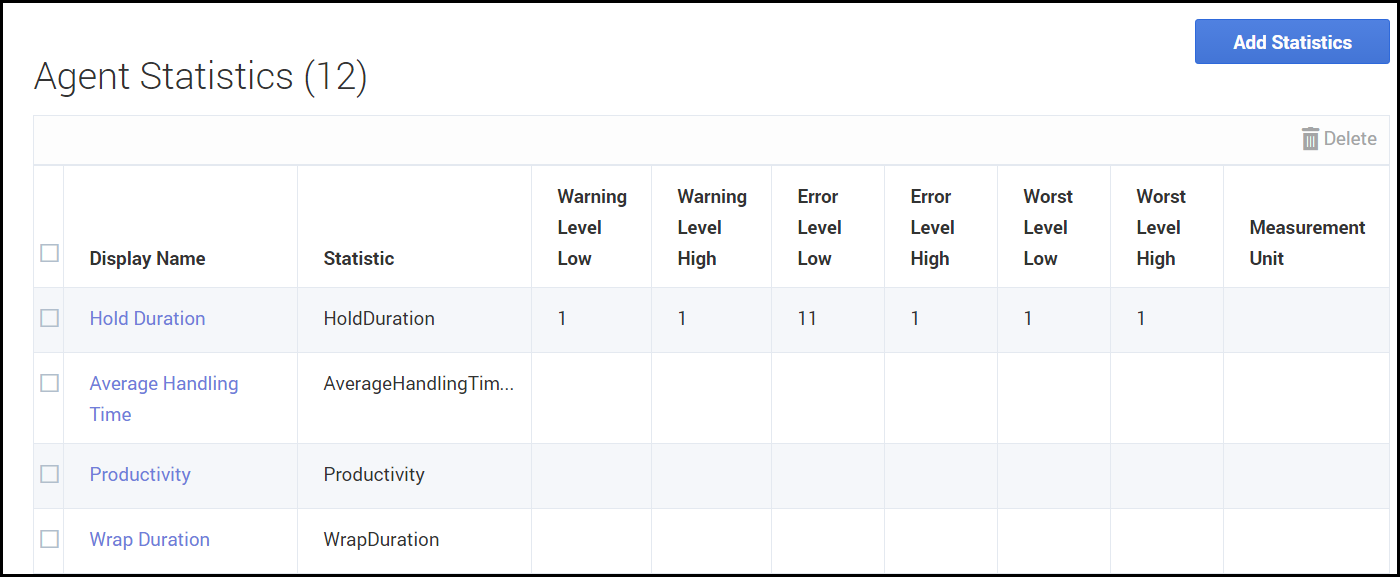
On Agent Statistics tab, manage the statistics that are displayed under My Reports to the agent. The My Reports page gives agents a view of the current state of their own activity.
If you don't see the statistic you want, you can create a new statistic for the global list and then add that statistic for the Agent Statistics list.
- Click Add Statistics.
- In the window that opens, click Add to create a new statistic.
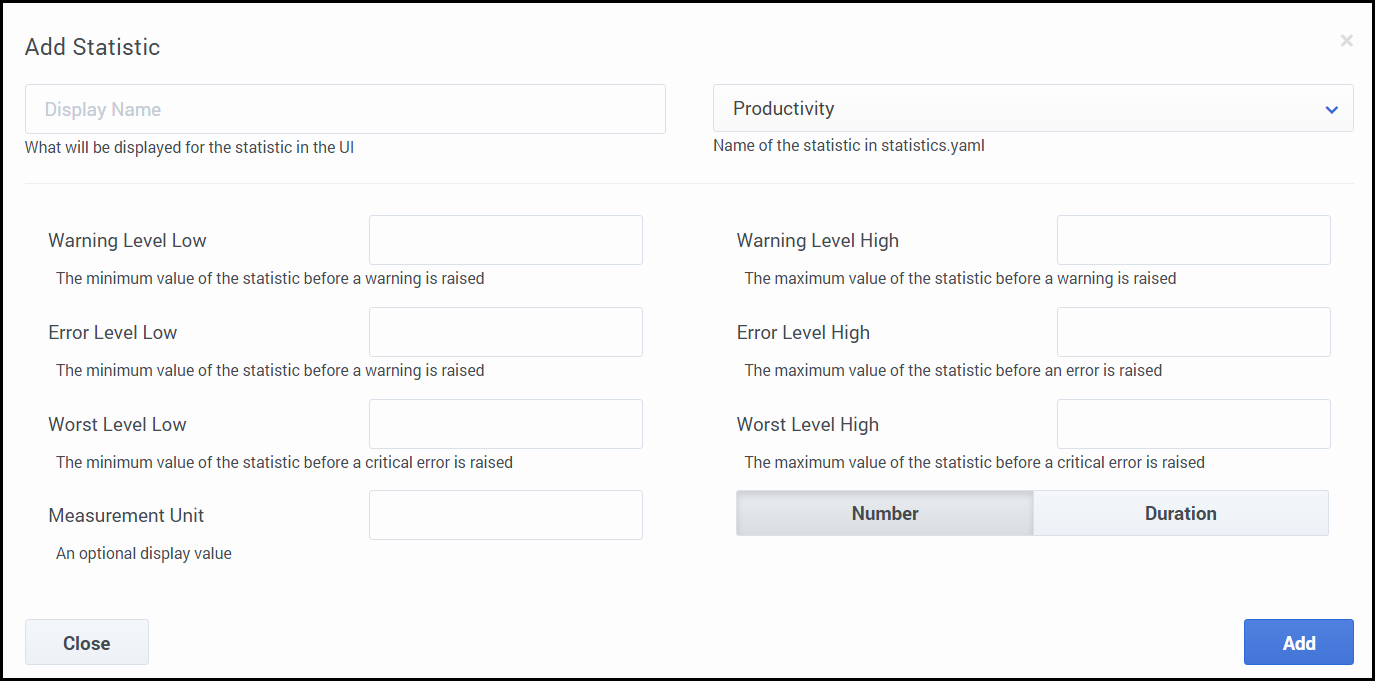
- In the Add Statistic window, configure the attributes.
- Click Add.
- The statistic is now listed in the list on the Add Statistic window. This means that the statistic is now available in the global list, but is not yet assigned.
- To assign the new statistic to Agent Statistics list, select the statistic and click Add.
- The window closes and the new statistic is assigned to the Agent Statistics list.
You can set the following attributes for each statistic that you specify to be displayed to agents.
- Display Name: The name of the statistic to be displayed.
- Name of the statistic in the statistics.yaml file: This must correspond to the value of the
nameattribute in the statistics.yaml file. - Warning Level Low: The minimum value of the statistic before a warning is raised. No warnings above this value.
- Warning Level High: The maximum value of the statistic before a warning is raised. No warnings below this value.
- Error Level Low: The minimum value of the statistic before an error is raised. No errors above this value.
- Error Level High: The maximum value of the statistic before an error is raised. No errors below this value.
- Worst Value Low: The minimum value of the statistic before a critical error is raised.
- Worst Value High: The maximum value of the statistic before a critical error is raised.
- Measurement Unit: an optional display value.
- Number: Indicates the statistic type is numeric.
- Duration: Indicates the statistic type is duration (in HH:MM:SS format).
Contact center statistics
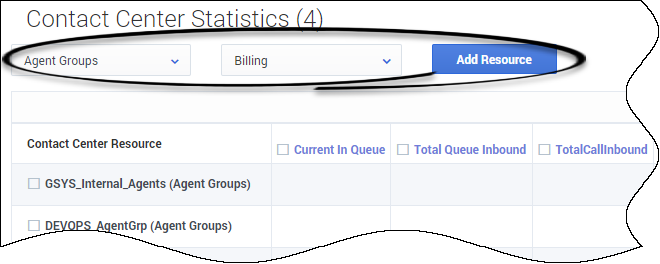
On the Contact Center Statistics tab, manage the statistics that are displayed under Contact Center. The Contact Center tab gives agents a view of the current state of activity for the call center.
To access the Contact Center Statistics tab, click Contact Center > Contact Center Statistics.
Statistics definitions
Using the Statistic Definitions tab, you can import, export, and edit statistic definitions. The supported formats for the statistic definition files are: .CSV and .YAML.
About CSV files
The .CSV file must be a text file in a comma-separated format. In the source file each line represents a single statistic.
About YAML files
Use a YAML file to import custom statistics from a valid .YAML file. The following example shows one custom statistic from a sample .YAML file:
name: ReadyDuration
 objectType: AGENT
 notificationMode: PERIODICAL
 notificationFrequency: 10
 statisticDefinitionEx:
   category: TotalAdjustedTime
   intervalType: GrowingWindow
   mainMask: WaitForNextCall
   subject: DNStatus
   dynamicTimeProfile: '8:00'
   dynamicFilter: MediaType=voice
 saveHistory: false
 insensitivity: 1
 location: /


