Difference between revisions of "PEC-AS/Current/ManageCC/Agent and contact center statistics"
m (Text replacement - "\|Platform=([^\|]*)GenesysEngage-onpremises([\|]*)" to "|Platform=$1GenesysEngage-cloud$2") |
(Published) |
||
| Line 8: | Line 8: | ||
|Platform=GenesysEngage-cloud | |Platform=GenesysEngage-cloud | ||
|Role=Administrator | |Role=Administrator | ||
| − | |||
|Section={{Section | |Section={{Section | ||
| − | |||
| − | |||
|alignment=Vertical | |alignment=Vertical | ||
| − | |||
| − | |||
|structuredtext=The '''Desktop Statistics''' section allows you to add, edit, import and export statistics to be displayed under '''My Reports''' and '''Contact Center''' panes of the Agent Desktop dashboard or the '''Reports''' view in Gplus Adapter. The '''Statistics''' tab includes three sub-tabs to help you manage your statistics: | |structuredtext=The '''Desktop Statistics''' section allows you to add, edit, import and export statistics to be displayed under '''My Reports''' and '''Contact Center''' panes of the Agent Desktop dashboard or the '''Reports''' view in Gplus Adapter. The '''Statistics''' tab includes three sub-tabs to help you manage your statistics: | ||
| Line 22: | Line 17: | ||
Essentially, you add statistics to a global statistics list. Then from that list, you can select the statistics that you want to apply. Statistics can be re-used, meaning that if you create a statistic for a specific agent group, for example, you can then apply that favorite to another agent group. | Essentially, you add statistics to a global statistics list. Then from that list, you can select the statistics that you want to apply. Statistics can be re-used, meaning that if you create a statistic for a specific agent group, for example, you can then apply that favorite to another agent group. | ||
| − | |||
| − | |||
|Status=No | |Status=No | ||
}}{{Section | }}{{Section | ||
| Line 29: | Line 22: | ||
|anchor=agentstats | |anchor=agentstats | ||
|alignment=Vertical | |alignment=Vertical | ||
| − | |||
| − | |||
|structuredtext=On '''Agent Statistics''' tab, manage the statistics that are displayed under '''My Reports''' to the agent. The '''My Reports''' page gives agents a view of the current state of their own activity. | |structuredtext=On '''Agent Statistics''' tab, manage the statistics that are displayed under '''My Reports''' to the agent. The '''My Reports''' page gives agents a view of the current state of their own activity. | ||
| − | |||
| − | |||
|Status=No | |Status=No | ||
}}{{Section | }}{{Section | ||
| − | |||
| − | |||
|alignment=Horizontal | |alignment=Horizontal | ||
|Media=Image | |Media=Image | ||
|image=UmgrAgentStatList.png | |image=UmgrAgentStatList.png | ||
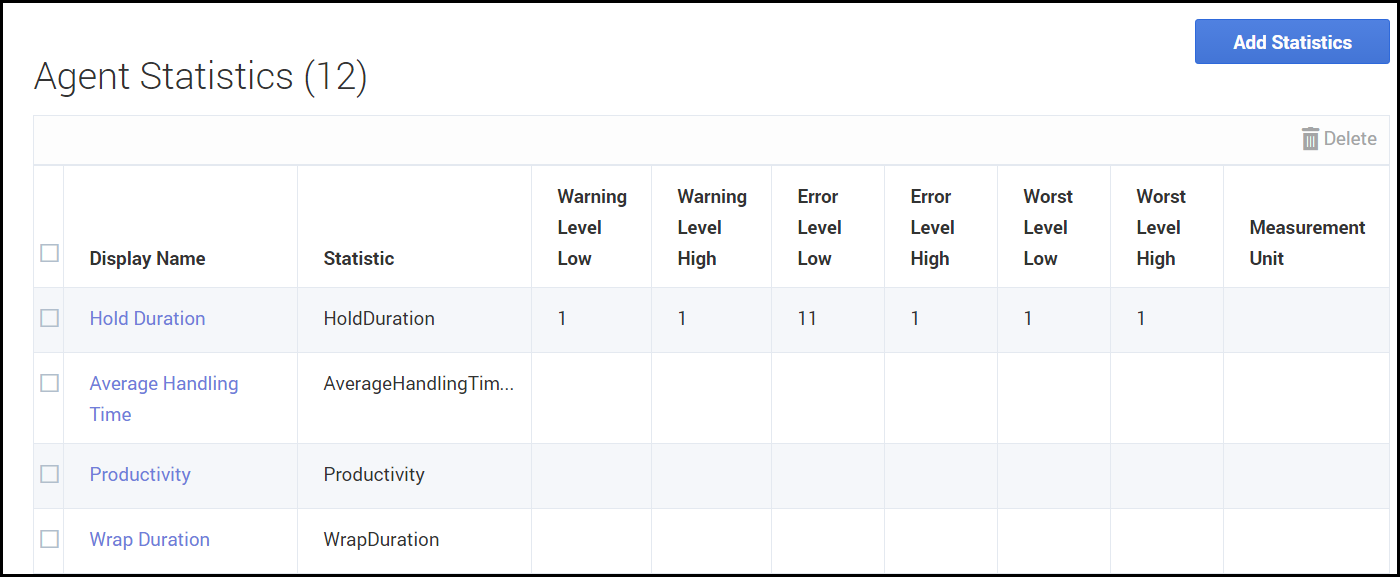
|structuredtext=To access the '''Agent Statistics''' tab, click '''Contact Center Settings > Agent Statistics'''. The list on the page includes all agent statistics that are already configured, either by you or another administrator. For a new implementation, the list might be blank. | |structuredtext=To access the '''Agent Statistics''' tab, click '''Contact Center Settings > Agent Statistics'''. The list on the page includes all agent statistics that are already configured, either by you or another administrator. For a new implementation, the list might be blank. | ||
| − | |||
| − | |||
|Status=No | |Status=No | ||
}}{{Section | }}{{Section | ||
| − | |||
| − | |||
|alignment=Horizontal | |alignment=Horizontal | ||
|Media=Image | |Media=Image | ||
|image=ASAddAgentStatistics.png | |image=ASAddAgentStatistics.png | ||
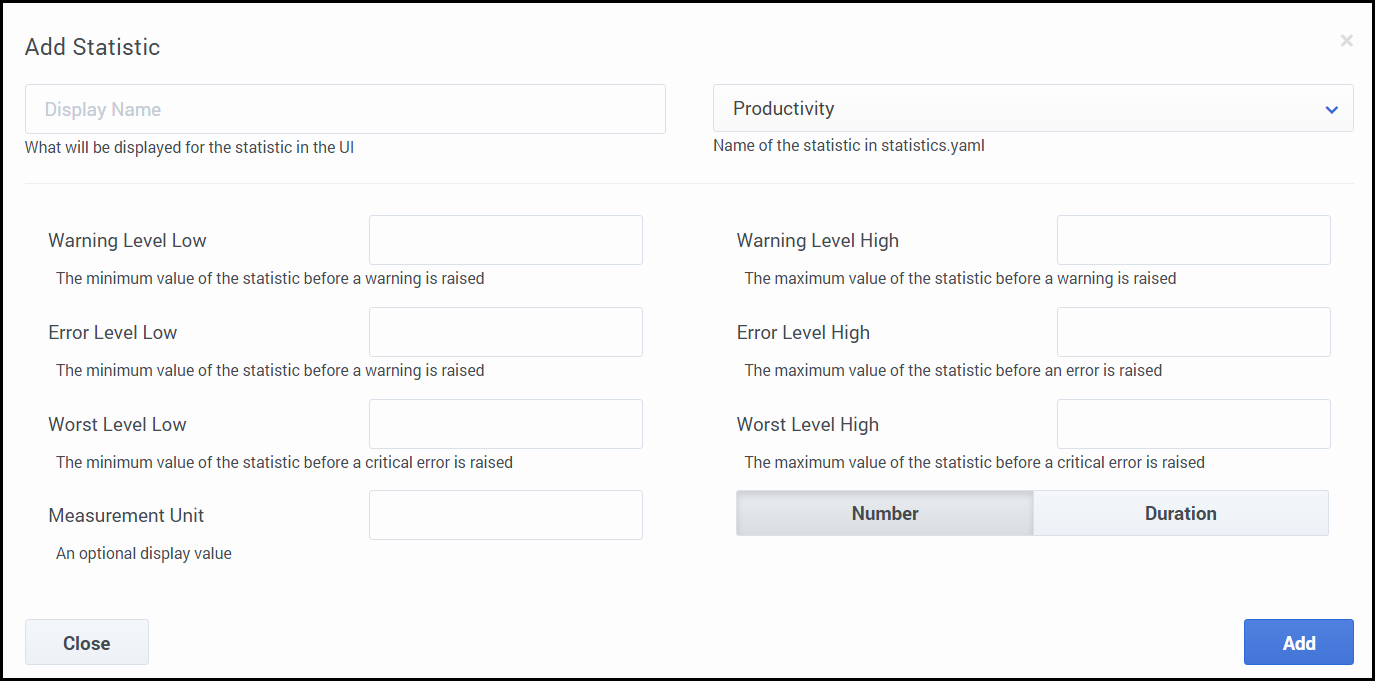
|structuredtext=To add a shared statistic to the list, click '''Add Statistics''' to access a list of shared statistics. In the window that opens, select an option from the list of statistics, and then click '''Add'''. | |structuredtext=To add a shared statistic to the list, click '''Add Statistics''' to access a list of shared statistics. In the window that opens, select an option from the list of statistics, and then click '''Add'''. | ||
| − | |||
| − | |||
|Status=No | |Status=No | ||
}}{{Section | }}{{Section | ||
| − | |||
| − | |||
|alignment=Horizontal | |alignment=Horizontal | ||
|Media=Image | |Media=Image | ||
| Line 83: | Line 62: | ||
*'''Number''': Indicates the statistic type is numeric. | *'''Number''': Indicates the statistic type is numeric. | ||
*'''Duration''': Indicates the statistic type is duration (in HH:MM:SS format). | *'''Duration''': Indicates the statistic type is duration (in HH:MM:SS format). | ||
| − | |||
|Status=No | |Status=No | ||
}}{{Section | }}{{Section | ||
| Line 89: | Line 67: | ||
|anchor=ccstats | |anchor=ccstats | ||
|alignment=Vertical | |alignment=Vertical | ||
| − | |||
| − | |||
|structuredtext=On the '''Contact Center Statistics''' tab, manage the statistics that are displayed under '''Contact Center'''. The '''Contact Center''' tab gives agents a view of the current state of activity for the call center. | |structuredtext=On the '''Contact Center Statistics''' tab, manage the statistics that are displayed under '''Contact Center'''. The '''Contact Center''' tab gives agents a view of the current state of activity for the call center. | ||
To access the '''Contact Center Statistics''' tab, click '''Contact Center > Contact Center Statistics'''. | To access the '''Contact Center Statistics''' tab, click '''Contact Center > Contact Center Statistics'''. | ||
| − | |||
| − | |||
|Status=No | |Status=No | ||
}}{{Section | }}{{Section | ||
| − | |||
| − | |||
|alignment=Horizontal | |alignment=Horizontal | ||
|Media=Image | |Media=Image | ||
|image=ASAddResources.png | |image=ASAddResources.png | ||
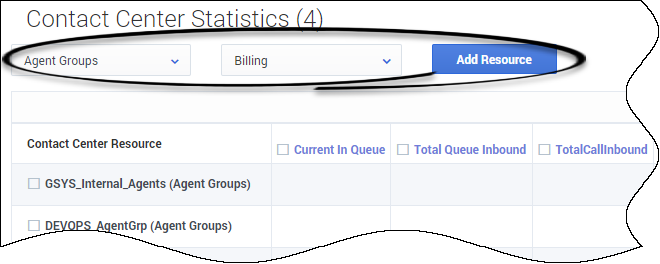
|structuredtext=To configure Contact Center Statistics, you must first add a resource. Resources can include agent groups, queues, DN groups, and routing points. In the first drop-down list box, select the type of resource you want to add, and then select the resource from the second drop-down list box. Click '''Add Resource'''. This action adds a row for the resource to the '''Contact Center Statistics''' table. | |structuredtext=To configure Contact Center Statistics, you must first add a resource. Resources can include agent groups, queues, DN groups, and routing points. In the first drop-down list box, select the type of resource you want to add, and then select the resource from the second drop-down list box. Click '''Add Resource'''. This action adds a row for the resource to the '''Contact Center Statistics''' table. | ||
| − | |||
| − | |||
|Status=No | |Status=No | ||
}}{{Section | }}{{Section | ||
| − | |||
| − | |||
|alignment=Horizontal | |alignment=Horizontal | ||
|Media=Image | |Media=Image | ||
|image=ASAddCCStats.png | |image=ASAddCCStats.png | ||
|structuredtext=Then you can add statistics by clicking '''Add Statistics'''. The '''Add Statistics''' window opens, where you can either select a preconfigured statistic or create a new one (see {{Link-SomewhereInThisVersion|manual=ManageCC|topic=Agent_and_contact_center_statistics|anchor=agentstats|display text=Agent statistics}}). This action adds a column to the '''Contact Center Statistics''' table. Continue adding the statistics that you want to add to the table. | |structuredtext=Then you can add statistics by clicking '''Add Statistics'''. The '''Add Statistics''' window opens, where you can either select a preconfigured statistic or create a new one (see {{Link-SomewhereInThisVersion|manual=ManageCC|topic=Agent_and_contact_center_statistics|anchor=agentstats|display text=Agent statistics}}). This action adds a column to the '''Contact Center Statistics''' table. Continue adding the statistics that you want to add to the table. | ||
| − | |||
| − | |||
|Status=No | |Status=No | ||
}}{{Section | }}{{Section | ||
| − | |||
| − | |||
|alignment=Horizontal | |alignment=Horizontal | ||
|Media=Image | |Media=Image | ||
|image=UmgrCCStatCheckmarks.png | |image=UmgrCCStatCheckmarks.png | ||
|structuredtext=When you are done, notice the black checkmarks in the '''Contact Center Statistics''' table. The black checkmarks indicate which statistics apply to each resource. For example, the '''current number in queue''' statistic does not apply to agent groups. Agent desktops shows only statistics with check marks; other desktops show only statistics with hyphens (-). | |structuredtext=When you are done, notice the black checkmarks in the '''Contact Center Statistics''' table. The black checkmarks indicate which statistics apply to each resource. For example, the '''current number in queue''' statistic does not apply to agent groups. Agent desktops shows only statistics with check marks; other desktops show only statistics with hyphens (-). | ||
| − | |||
| − | |||
|Status=No | |Status=No | ||
}}{{Section | }}{{Section | ||
| − | |||
| − | |||
|alignment=Vertical | |alignment=Vertical | ||
| − | |||
| − | |||
|structuredtext={{NoteFormat|Agents can only see Route Points on switches they are given permission to view. For example: Your Contact Center Statistics are configured to monitor the following routing points: RP1, RP2, and RP3. RP1 belongs to one switch while RP2 and RP3 belong to another switch. An agent who is only configured to log into the switch that contains RP1 can only see RP1 in the Contact Center Statistics. RP2 and RP3 are not visible to the agent because they belong to a switch that agent doesn’t have permission to access.|}} | |structuredtext={{NoteFormat|Agents can only see Route Points on switches they are given permission to view. For example: Your Contact Center Statistics are configured to monitor the following routing points: RP1, RP2, and RP3. RP1 belongs to one switch while RP2 and RP3 belong to another switch. An agent who is only configured to log into the switch that contains RP1 can only see RP1 in the Contact Center Statistics. RP2 and RP3 are not visible to the agent because they belong to a switch that agent doesn’t have permission to access.|}} | ||
| − | |||
| − | |||
|Status=No | |Status=No | ||
}}{{Section | }}{{Section | ||
| Line 141: | Line 97: | ||
|anchor=defs | |anchor=defs | ||
|alignment=Vertical | |alignment=Vertical | ||
| − | |||
| − | |||
|structuredtext=Using the '''Statistic Definitions''' tab, you can import, export, and edit statistic definitions. The supported formats for the statistic definition files are: .CSV and .YAML. | |structuredtext=Using the '''Statistic Definitions''' tab, you can import, export, and edit statistic definitions. The supported formats for the statistic definition files are: .CSV and .YAML. | ||
| + | |||
| + | {{NoteFormat|The Import and Export features are only available for Workspace Web Edition 8.5.|}} | ||
====About CSV files==== | ====About CSV files==== | ||
| + | |||
The .CSV file must be a text file in a comma-separated format. In the source file each line represents a single statistic. | The .CSV file must be a text file in a comma-separated format. In the source file each line represents a single statistic. | ||
| Line 165: | Line 122: | ||
insensitivity: 1 | insensitivity: 1 | ||
location: /</tt> | location: /</tt> | ||
| − | |||
| − | |||
|Status=No | |Status=No | ||
}}{{Section | }}{{Section | ||
| − | |||
| − | |||
|alignment=Horizontal | |alignment=Horizontal | ||
|Media=Image | |Media=Image | ||
| Line 176: | Line 129: | ||
|structuredtext=====How do I import custom statistic definitions?==== | |structuredtext=====How do I import custom statistic definitions?==== | ||
To import a .CSV or .YAML file that contains your custom statistic definitions, click '''Import''', select your file, and then click '''Open'''. User Setup validates the file and indicates which, if any, values need to be corrected. If you receive such a message, make the recommended corrections and then try again. | To import a .CSV or .YAML file that contains your custom statistic definitions, click '''Import''', select your file, and then click '''Open'''. User Setup validates the file and indicates which, if any, values need to be corrected. If you receive such a message, make the recommended corrections and then try again. | ||
| − | |||
| − | |||
|Status=No | |Status=No | ||
}}{{Section | }}{{Section | ||
| − | |||
| − | |||
|alignment=Horizontal | |alignment=Horizontal | ||
|Media=Image | |Media=Image | ||
| Line 187: | Line 136: | ||
|structuredtext=====How do I export statistic definitions?==== | |structuredtext=====How do I export statistic definitions?==== | ||
You can export your statistic definitions to an external .CSV or .YAML file. You can select your custom statistics, global statistics, or both. Then you can choose which file type to export. The exported file downloads to your local computer. | You can export your statistic definitions to an external .CSV or .YAML file. You can select your custom statistics, global statistics, or both. Then you can choose which file type to export. The exported file downloads to your local computer. | ||
| − | |||
| − | |||
|Status=No | |Status=No | ||
}} | }} | ||
}} | }} | ||
Revision as of 13:09, November 27, 2020
Contents
Learn about the available agent and contact center statistics.
The Desktop Statistics section allows you to add, edit, import and export statistics to be displayed under My Reports and Contact Center panes of the Agent Desktop dashboard or the Reports view in Gplus Adapter. The Statistics tab includes three sub-tabs to help you manage your statistics:
Essentially, you add statistics to a global statistics list. Then from that list, you can select the statistics that you want to apply. Statistics can be re-used, meaning that if you create a statistic for a specific agent group, for example, you can then apply that favorite to another agent group.
Agent statistics
On Agent Statistics tab, manage the statistics that are displayed under My Reports to the agent. The My Reports page gives agents a view of the current state of their own activity.
If you don't see the statistic you want, you can create a new statistic for the global list and then add that statistic for the Agent Statistics list.
- Click Add Statistics.
- In the window that opens, click Add to create a new statistic.
- In the Add Statistic window, configure the attributes.
- Click Add.
- The statistic is now listed in the list on the Add Statistic window. This means that the statistic is now available in the global list, but is not yet assigned.
- To assign the new statistic to Agent Statistics list, select the statistic and click Add.
- The window closes and the new statistic is assigned to the Agent Statistics list.
You can set the following attributes for each statistic that you specify to be displayed to agents.
- Display Name: The name of the statistic to be displayed.
- Name of the statistic in the statistics.yaml file: This must correspond to the value of the
nameattribute in the statistics.yaml file. - Warning Level Low: The minimum value of the statistic before a warning is raised. No warnings above this value.
- Warning Level High: The maximum value of the statistic before a warning is raised. No warnings below this value.
- Error Level Low: The minimum value of the statistic before an error is raised. No errors above this value.
- Error Level High: The maximum value of the statistic before an error is raised. No errors below this value.
- Worst Value Low: The minimum value of the statistic before a critical error is raised.
- Worst Value High: The maximum value of the statistic before a critical error is raised.
- Measurement Unit: an optional display value.
- Number: Indicates the statistic type is numeric.
- Duration: Indicates the statistic type is duration (in HH:MM:SS format).
Contact center statistics
On the Contact Center Statistics tab, manage the statistics that are displayed under Contact Center. The Contact Center tab gives agents a view of the current state of activity for the call center.
To access the Contact Center Statistics tab, click Contact Center > Contact Center Statistics.
Statistics definitions
Using the Statistic Definitions tab, you can import, export, and edit statistic definitions. The supported formats for the statistic definition files are: .CSV and .YAML.
About CSV files
The .CSV file must be a text file in a comma-separated format. In the source file each line represents a single statistic.
About YAML files
Use a YAML file to import custom statistics from a valid .YAML file. The following example shows one custom statistic from a sample .YAML file:
name: ReadyDuration
 objectType: AGENT
 notificationMode: PERIODICAL
 notificationFrequency: 10
 statisticDefinitionEx:
   category: TotalAdjustedTime
   intervalType: GrowingWindow
   mainMask: WaitForNextCall
   subject: DNStatus
   dynamicTimeProfile: '8:00'
   dynamicFilter: MediaType=voice
 saveHistory: false
 insensitivity: 1
 location: /


