The Workflow Debugger
The Workflow Debugger allows you to test Workflows simulating the Gplus Adapter's functioning.
Unlike the current model, which necessarily needs the whole Gplus Adapter and the Genesys Multicloud CX environment, you can test the Workflows you designed with a useful tool coming along with the Workflow Designer: the Workflow Debugger, a sort of Adapter simulator.
The Adapter triggers Events inside Microsoft Dynamics 365 with a specific message. The Workflow Debugger simulates the trigger of this message exactly like the Adapter would do.
Displaying the Workflow Debugger
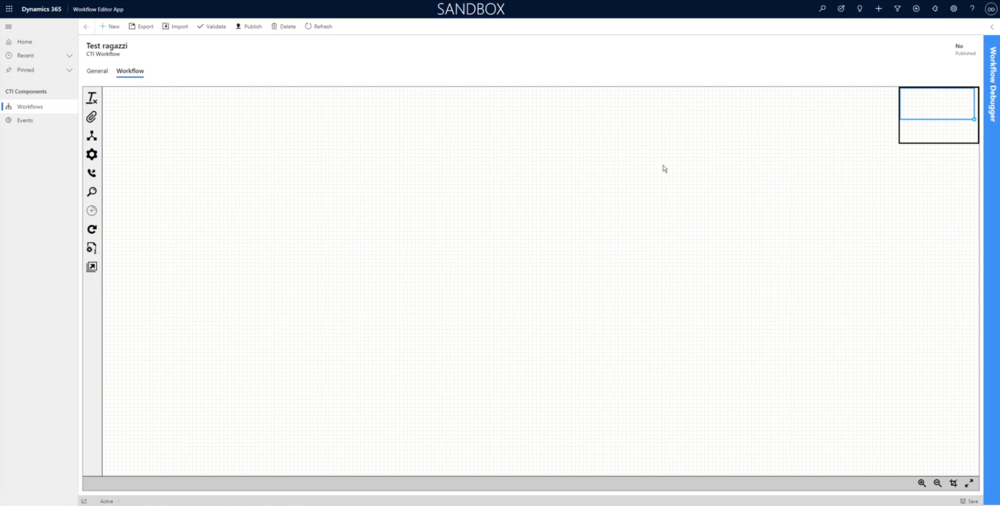
The Workflow Debugger is not displayed just after the Designer installation. To activate it, follow this procedure.
- Open the CIF application by clicking the Microsoft Dynamics 365 list menu and selecting Channel Integration Framework.
- Create a new channel provider by clicking + New.
- Provide the following parameters:
- Name: any name
- Label: Workflow Debugger
- Channel URL: "https://<DynamicsDomain>/webresources/softphon_WorkflowDebugger.html"
- Enable Outbound Communication: No
- Channel Order: 1
- API Version: 1.0
- Trusted Domain:
- Custom Parameters:
- Insert Workflow Editor App in the central selection (select Unified Interface Apps for the Channel).
- Click Save.
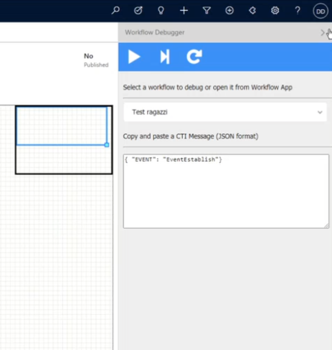
After this procedure, the Workflow Debugger will be displayed on the right side.
Click it and it will open.
Using the Workflow Debugger
The Workflow Debugger has three controls:
| Icon | Description |
|---|---|
| Entirely runs the Workflow. | |
| Runs the Workflow step by step. | |
| Refreshes the Workflow. |
All created Workflows are visible in the list menu. You can switch from one to another just by selecting one.
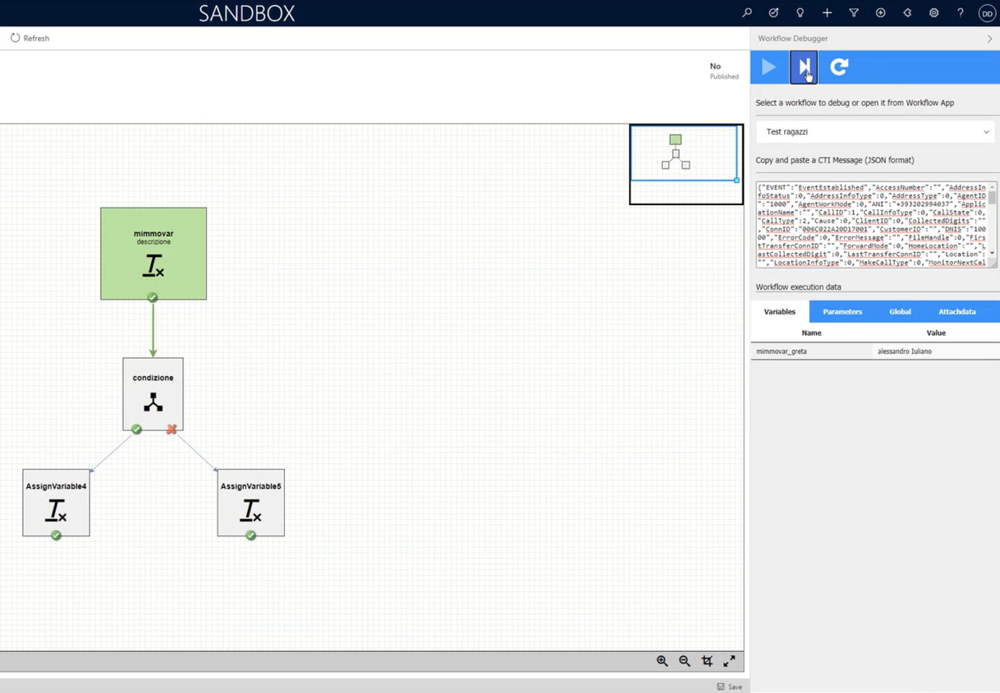
Within the Execution Data section, you can check all parameters on which the Workflow can operate. When running Workflows step by step, the Workflow Debugger shows information dynamically evaluated for each step here.
All tested and working sections of the Workflow turn green.
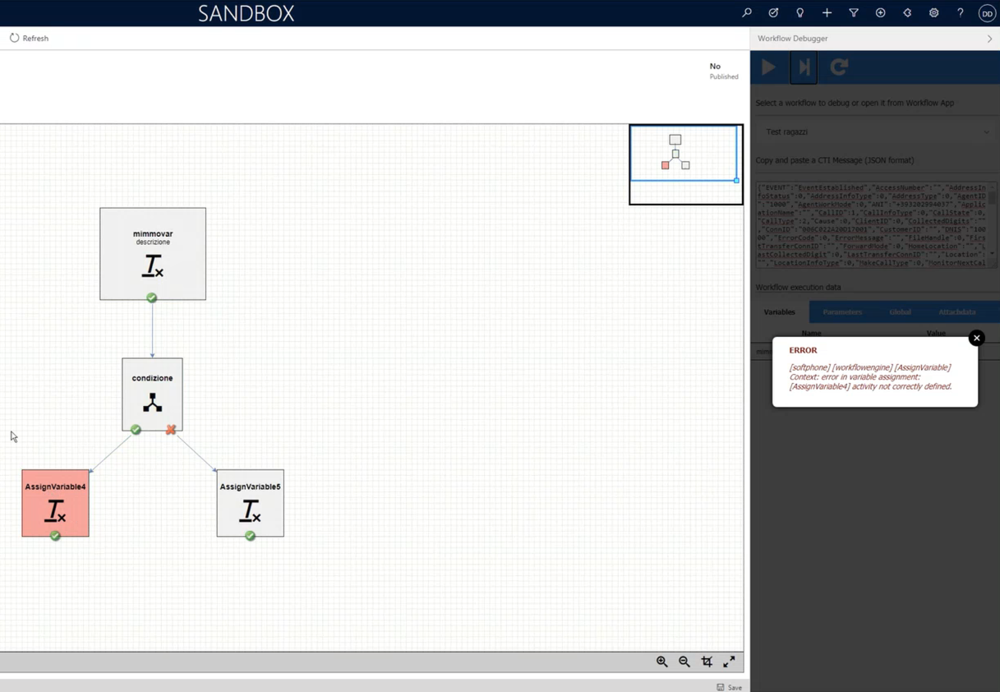
In the case of an error, the incorrect sections are highlighted in red, while an error description is displayed on the right.
When you run a screen-pop test, you can return to the Workflow Designer:
- Either clicking Workflow Editor App in the upper left corner,
- Or reselecting the wanted Workflow from the Workflow Debugger list menu.


