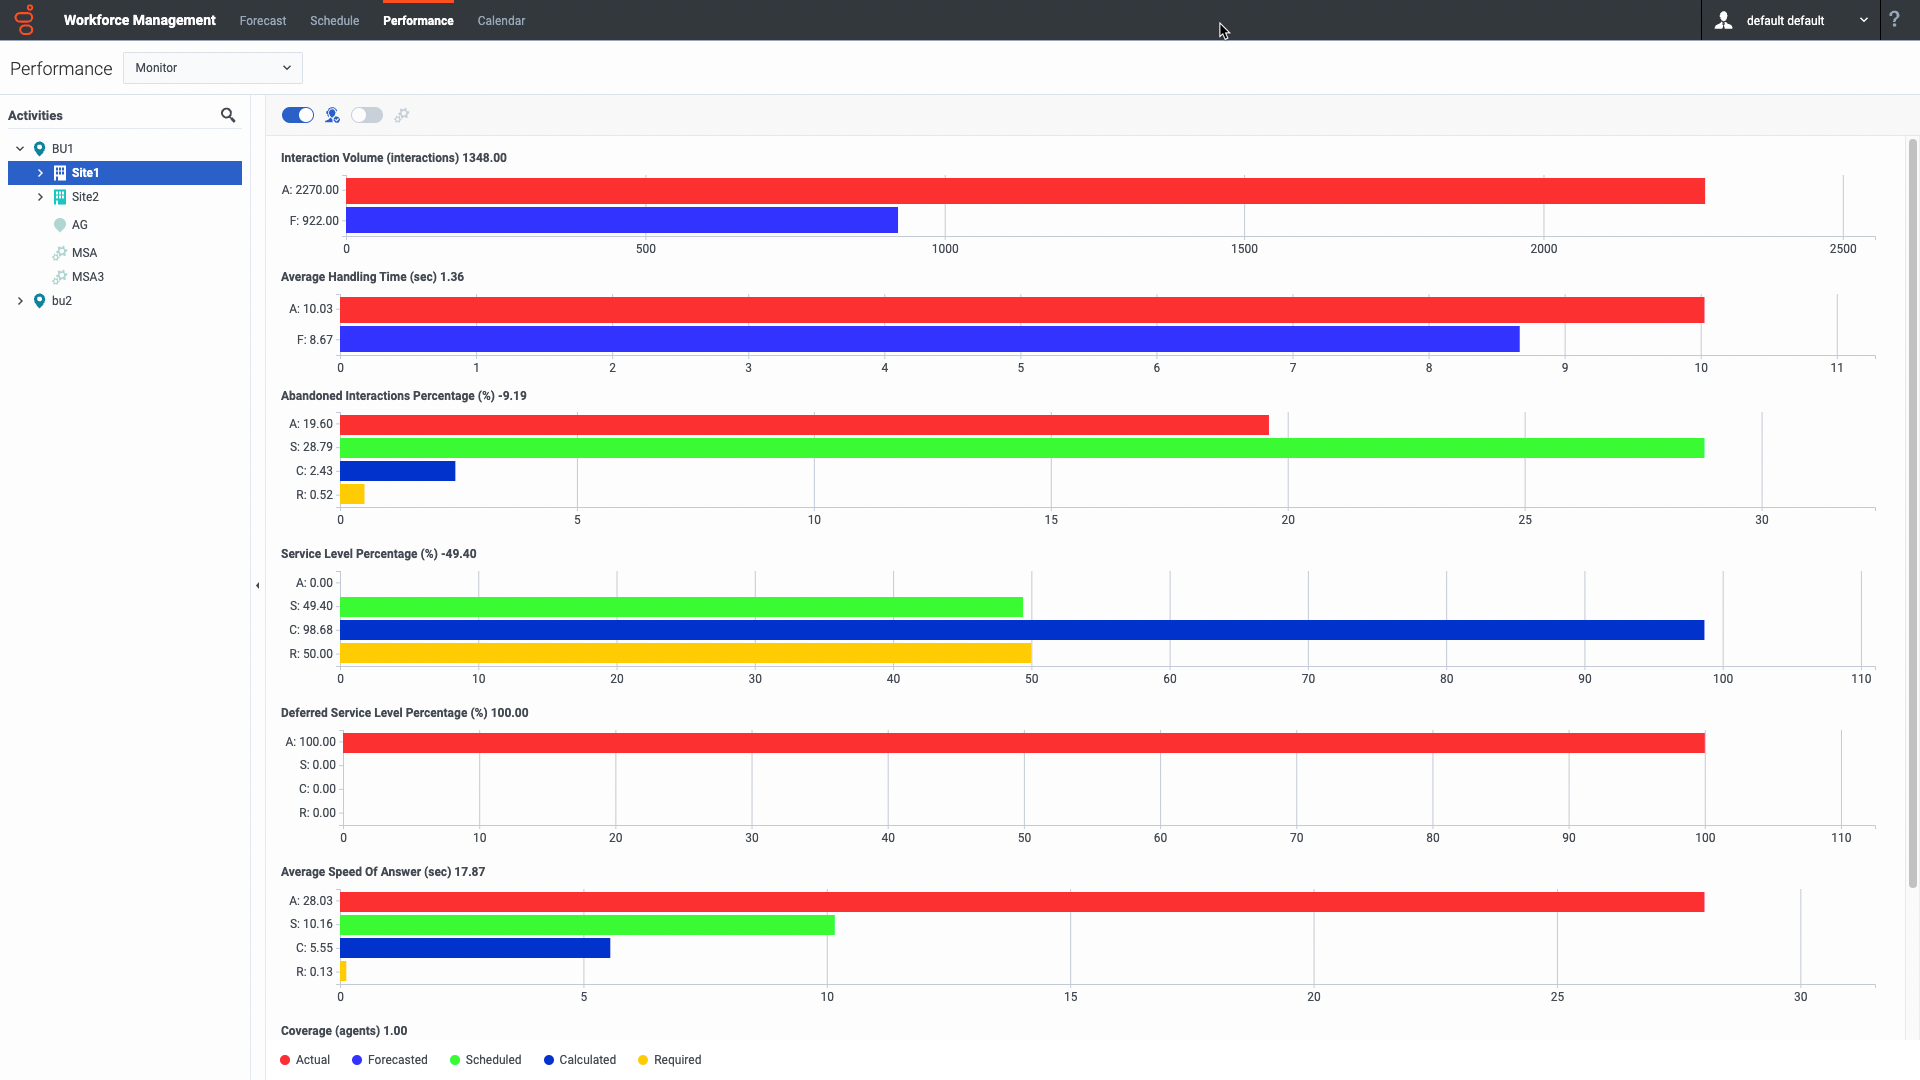
Performance Monitor View
Use the Monitor view to display performance statistics for the most recently completed timsetep.
Displaying the Monitor view
To display the Monitor view, click the Performance tab and select Monitor (or use the Performance view dropdown list to switch the view to Monitor). If you switched to this view from another Performance view, it retains your earlier Activities tree selection and shows graphs for the most recent timestep.
From the Activities tree, select the business unit, multi-site activity, activity group, or site you want to view. You can expand business units to show their sites, activity groups, and multi-site activities, and expand sites to show their activities. If you make a new selection, the graphs refresh to match it.
You can also click the Search icon to open the search bar and enter the name of the object you want to find and view.Reading the data
The Monitor view shows as many graphs as can fit on the screen at once. Use the scroll bar to the right to reveal graphs for additional statistics.
Each graph shows actual data, and either forecasted data or scheduled and required data. The displayed data is automatically refreshed at the conclusion of each 15-minute timestep, and represents the values from the most recent timestep.
The Legend (at the bottom) shows which color bar indicates which data category. Next to each data bar, a label lists the numerical value shown on the graph, with the following prefixes:
- A for actual data
- F for forecasted
- S for scheduled
- C for calculated
- R for required
Required data options
You can use the following controls to change the required data viewing options:


