Performance Intra-Day View
Contents
Use the Intra-Day view to display performance statistics (both summarized and detailed) in a grid.
Displaying the Intra-Day view
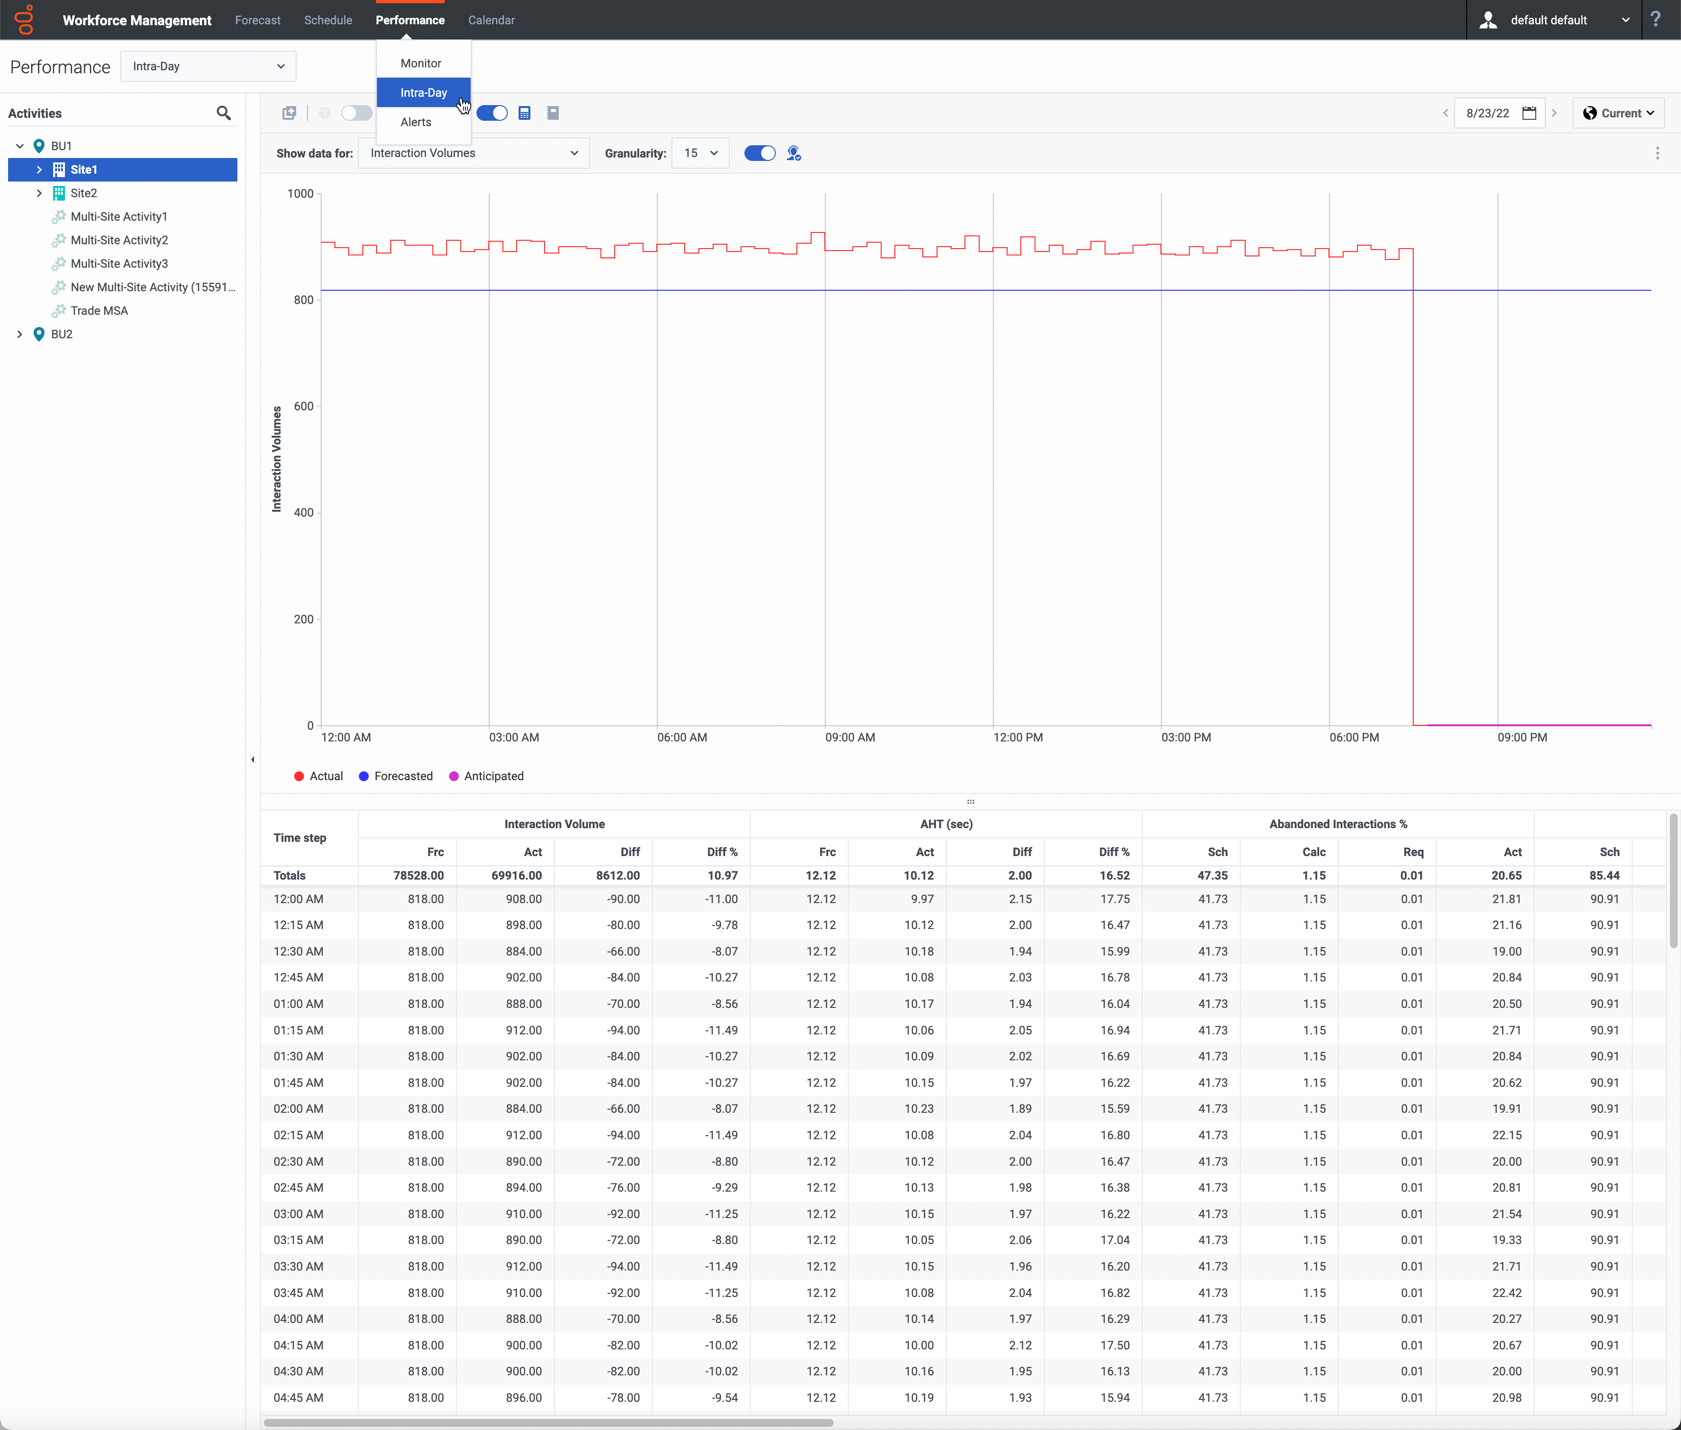
To display the Intra-Day view, select Intra-Day from the Performance module menu (or use the Performance view dropdown list to switch the view to Intra-Day). If you switch to this view from another Performance view, it retains your earlier Activities selection and shows the corresponding statistics.
From the Activities tree, select the business unit, multi-site activity, activity group, or site you want to view. You can expand business units to show their sites and activity groups and multi-site activities, and expand sites to show their activities. If you make a new selection, the grid is updated to match it.
You can also click the Search icon to open the search bar and enter the name of the object you want to view.
Setting the Time Zone, Granularity, and Date
Use the Time Zone, Granularity and Date controls to customize the graph.
Time Zone
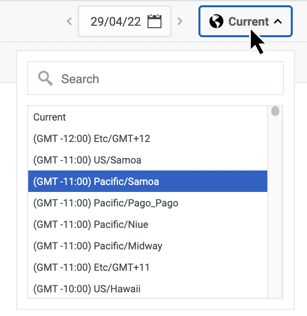
Use the Time Zone dropdown list (at the top right-hand side of the screen) to choose the time zone to display in the graph and grid. By default, this is set to Current (the local time zone).
Granularity
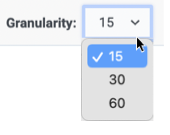
Use the Granularity dropdown list to select the time interval (in minutes) for the graph's horizontal axis, and also for timesteps in the table below the graph. You can select 15 (default), 30, or 60 minutes.
Date
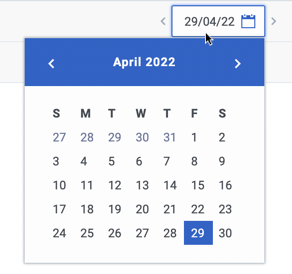
Use the calendar tool to choose the Date to display in the graph and grid. By default, this is set to the current date.
Reading and configuring the graph
By default, information for the Interaction Volumes statistic is shown.
- To switch the graph to match a different statistic, select the statistic from the Show Data for list.
- Toggle the Show Required slider on (
 ) to display required data in the graph.
The graph shows times on the horizontal axis and values on the vertical axis. The legend (below the graph) indicates which color is used for each data category.
Reading and navigating the grid
For each statistic, the grid displays actual values compared to forecasted, or scheduled and required, values. The displayed data is automatically refreshed at the conclusion of each 15-minute timestep, and represents the values from the most recent timestep. The grid's rows show timesteps, and its columns show statistic categories. The current timestep is identified by a yellow background.
By default, the Show Whole Day toggle on the Actions toolbar is switched on to display a current-day view that shows midnight to midnight of the current day. Switch it off to instead display a rolling view that shows 12 hours before and 12 hours after the current timestep. This toggle is disabled if the day selected in the Date selection control is not a current date. When switched on, the performance grid starts at midnight.
Grid Rows
The grid contains the following rows, which are labeled in the Time Step column:
| First row (--) | The first row displays summary (aggregate total or average) values for each statistic, calculated from the grid's first displayed timestep until the current timestep. |
| Timestep rows (numbered) | The remaining rows show 15-, 30-, or 60-minute timesteps. There are 24 hours' worth of data, which may be shown as including 12 hours before, and 12 hours after, the current timestep (rolling view) or from midnight to midnight of the current day (Current Day view). The Current Day view is the default view.
Use the scroll bar to the right to reveal more timesteps. A yellow bar indicates the current timestep. |
Grid Columns
The grid's remaining columns show the following statistics and subcategories (these statistics are present in all views, and are described in the Performance overview):
- Interaction Volume
- AHT
- Abandoned Interactions
- Service Level
- Deferred Service Level
- Actual Queue
- ASA
- Staffing
- Variance
- Coverage
- Headcount
Anticipated Values
For Interaction Volume and AHT, future "actual" timestep values are calculated based on the ratio of previous actual/forecast values from moment to moment. For the other columns, values for future timesteps are forecasted based on anticipated IV and AHT. Actual values replace these anticipated values as the displayed data is refreshed.
Display, copy/paste, and other options
The Intra-Day view allows you to copy data from the grid to the clipboard and then paste it into another application. You can use the Copy button (![]() ) provided on the toolbar or use your operating system's copy keyboard shortcut (such as Ctrl+C or Command+C).
) provided on the toolbar or use your operating system's copy keyboard shortcut (such as Ctrl+C or Command+C).
Toolbar buttons
You can use the following buttons on the toolbar:
| Icon | Name | Description |
|---|---|---|
| Copy | Click to copy data from the grid to the clipboard so you can paste it into another application. | |
| What-if? | Click to launch the What-If Window to immediately analyze how changes in some statistics would affect other factors. | |

|
Use Multi-site Activities | This slider is enabled when you select a multi-site activity or business unit in the Activities tree. When switched on, WFM retains your last selection in the current view and for all other views that contain multi-site activities, preventing you from having to click it every time you want to display data for the selected multi-site activity. |

|
Show Whole Day | Toggle this slider on (default) to display a current-day view from midnight to midnight of the current day. When switched off, displays a rolling view of 12 hours before and 12 hours after the current timestep. |

|
Total Forecasted Values for Whole Day | Toggle this slider on to calculate totals across the grid's top row using actual performance data (displayed above the horizontal yellow line that indicates the current time slot) and forecast data (displayed below the line).
When toggled off, it calculates totals across the grid's top row using actual performance data only. Tip This option affects only how the totals row is calculated, using the currently displayed data. |
| Move to Current Day | Click to display data for today. | |
| Options | Click to display the Performance Options dialog with a list of statistics that can be displayed in the grid. |
Displaying statistics in the grid
Selecting the Options button in the Performance Intra-Day view opens the Show Statistics dialog, which contains a list of statistics that can be displayed in the grid. By default all are selected. To clear or select any individual statistic, click its check box. There is a check box at the top of the list that selects or clears all statistics at once.
Click Done to accept your changes or Cancel to abandon them.
For a list of statistics and their descriptions, see Performance.


