Master Forecasts
Contents
Learn how to use the settings and understand and manage the data, and find events in the Master Forecast views.
WFM Master Forecast consists of the volumes and staffing data that is built on forecast scenarios that have been published. Here's what you'll find in these views:
- Master Forecast > Volumes—Interaction volumes (IV) and average handle time (AHT) data.
- Master Forecast > Staffing—Calculated and required staffing data.
- Master Forecast > Shrinkage—Overhead data, which WFM uses to forecast shrinkage while scheduling.
Note that the Forecast > Scenarios view also has Volumes, Staffing and Shrinkage views. These views are similar, but in some ways different from the Master Forecast views. For example, you might create several forecast scenarios containing volumes, staffing, and shrinkage data before choosing one that is optimal for publishing to the Master Forecast.
Viewing the volumes data
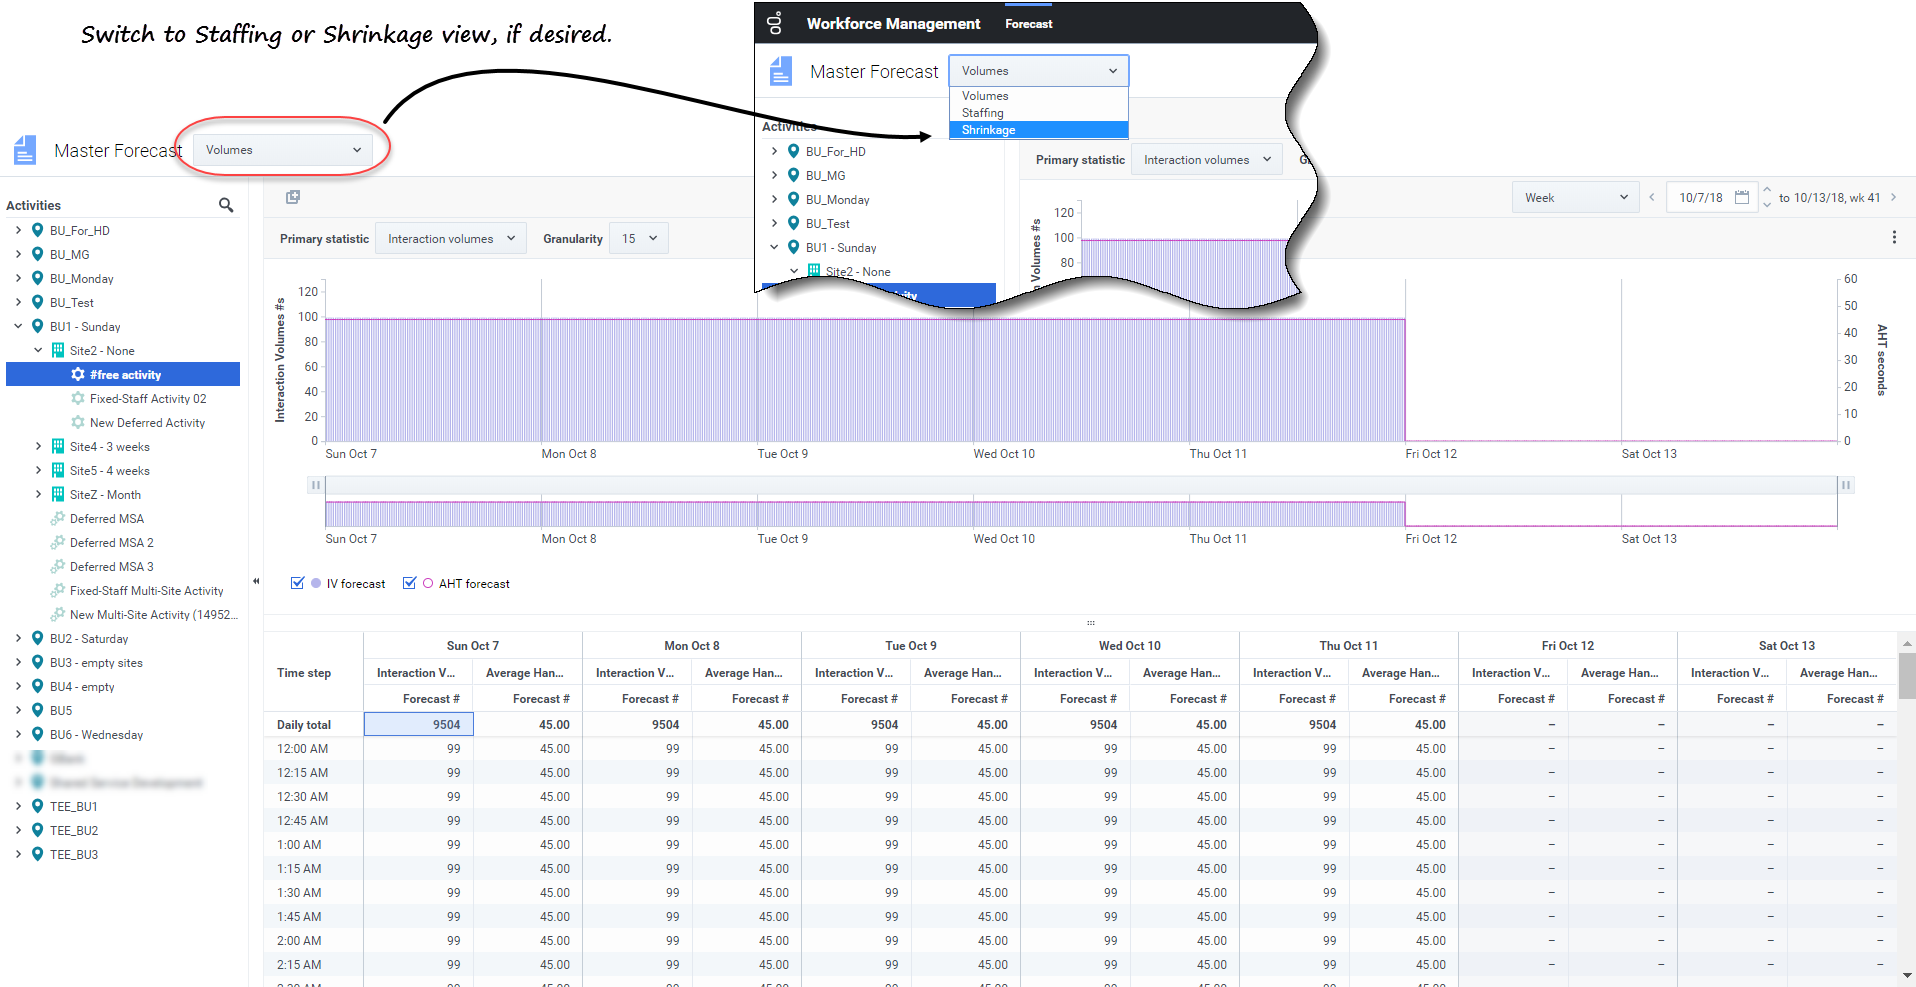
Use the Forecast Volumes view in the Master Forecast to display the interaction volumes (IV) and average handle time (AHT) data. When you select an object in this view, the start date is determined by the selected business unit's week start day setting, regardless of your locale settings.
This view provides standard date-selectors and a grid that shows statistics for days or timesteps.
Opening the Volumes view in the Master Forecast
- In the navigation bar, select Forecast > Volumes.
- In the Objects tree, expand a business unit to select a site, activity, or multi-site activity.
The view displays a graph above a table, each containing the same statistics and controls that set the data display properties.
If you do not see any volumes data, you can adjust the Period drop-down list, the sliders (below the graph), or the Granularity and date-selectors at the top of the window to reflect those used for the forecast.
The grid displays open hours for selected site activities and multi-site activities in the same way.
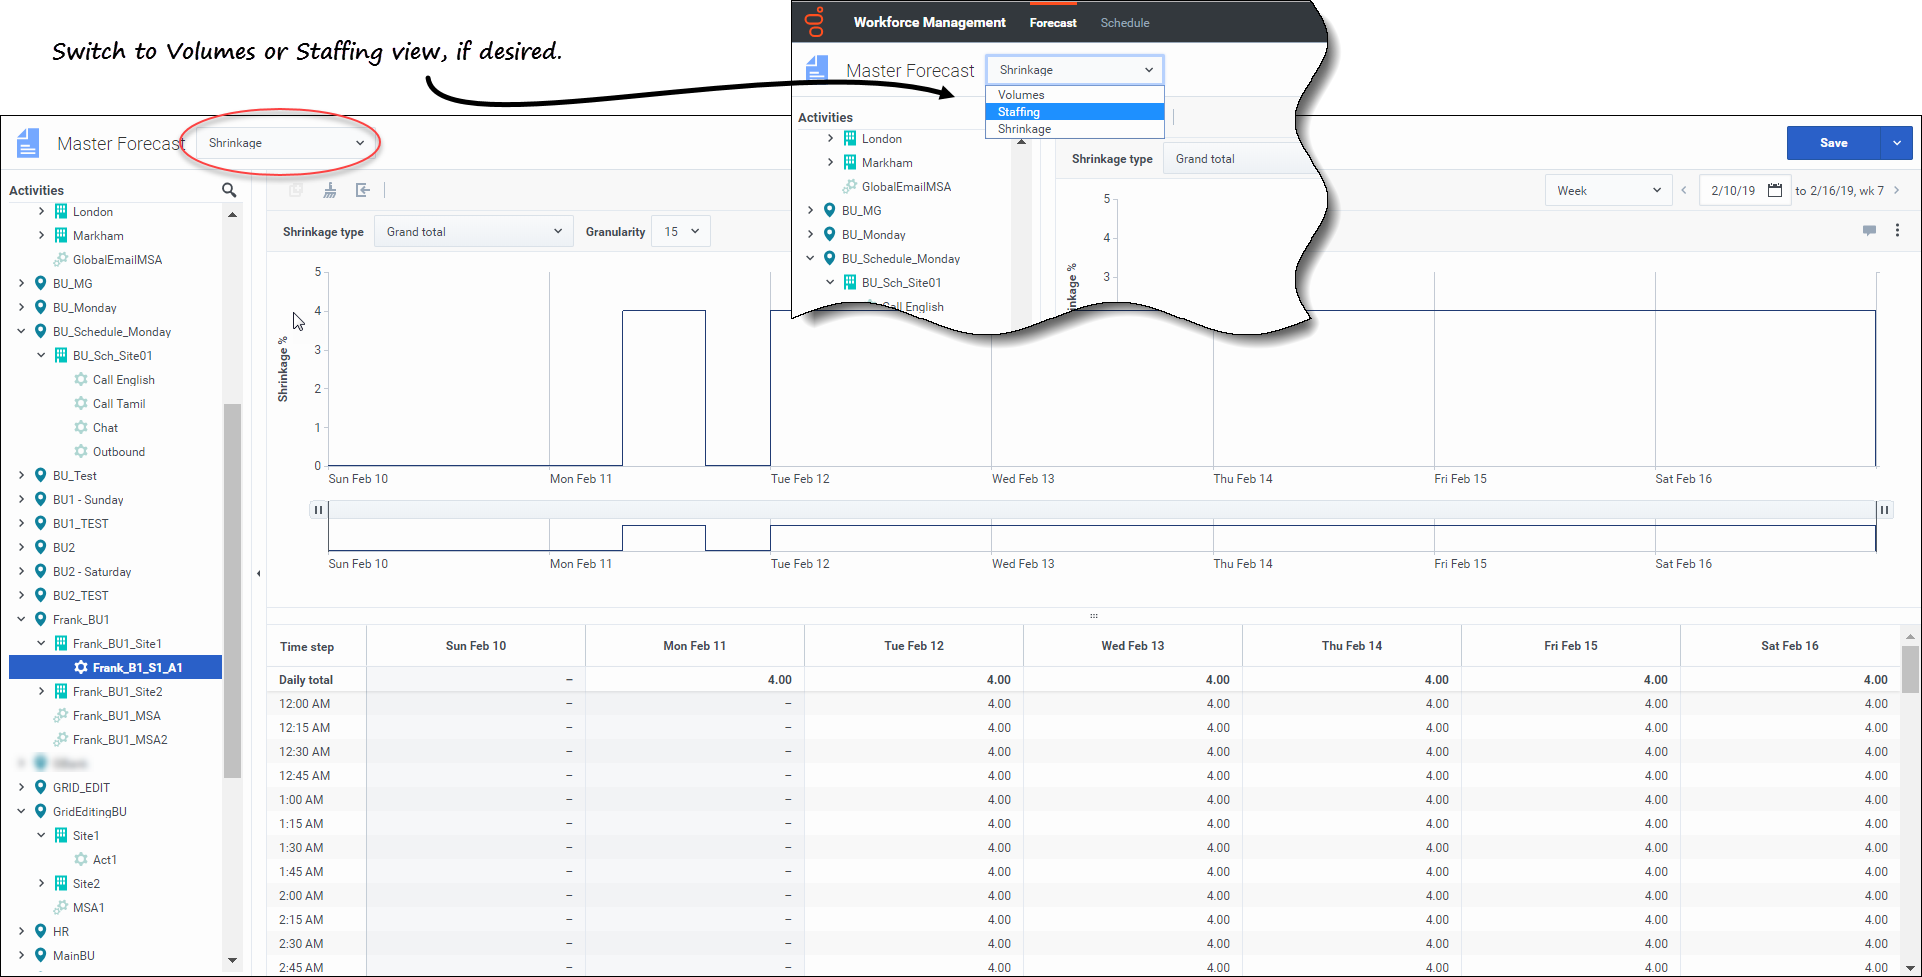
You can view the staffing or shrinkage data in the Master Forecast, by selecting Staffing or Shrinkage from the drop-down list in the top-left corner of this view.
Setting the data display properties
In this view, use the following controls to customize the data display:
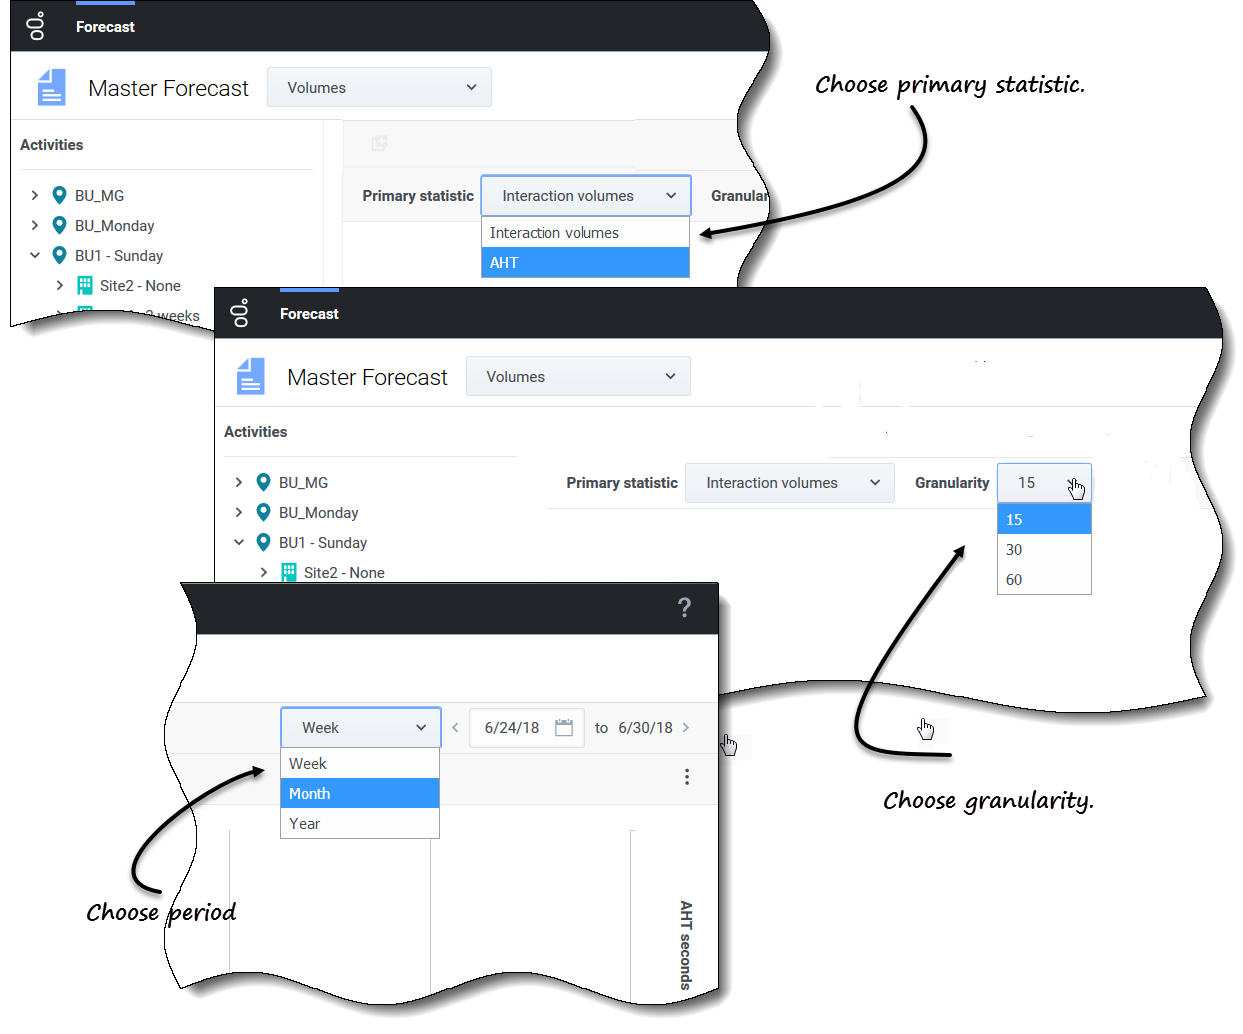
- Primary statistic drop-down list—Select the statistic that will be displayed as primary, by selecting Interaction Volume (IV) or AHT (average handle time). The primary statistic displays as a bar in the graph and the secondary statistic displays as a red line.
- Granularity drop-down list—Select Month or Year to adjust the granularity to Day. Select Week to further adjust each row's time range by selecting 15, 30, or 60 (minutes) from this list.
- Period drop-down list—Change the time range for the graph and grid by selecting Year, Month, or Week. If the selected site has a configured planning period, you can also select Planning Period.
- Date range—Use the date-selectors (top-right portion of the view) to switch to a different period within the scenario forecast's date range. The week number is also displayed here when the selected period is Week.
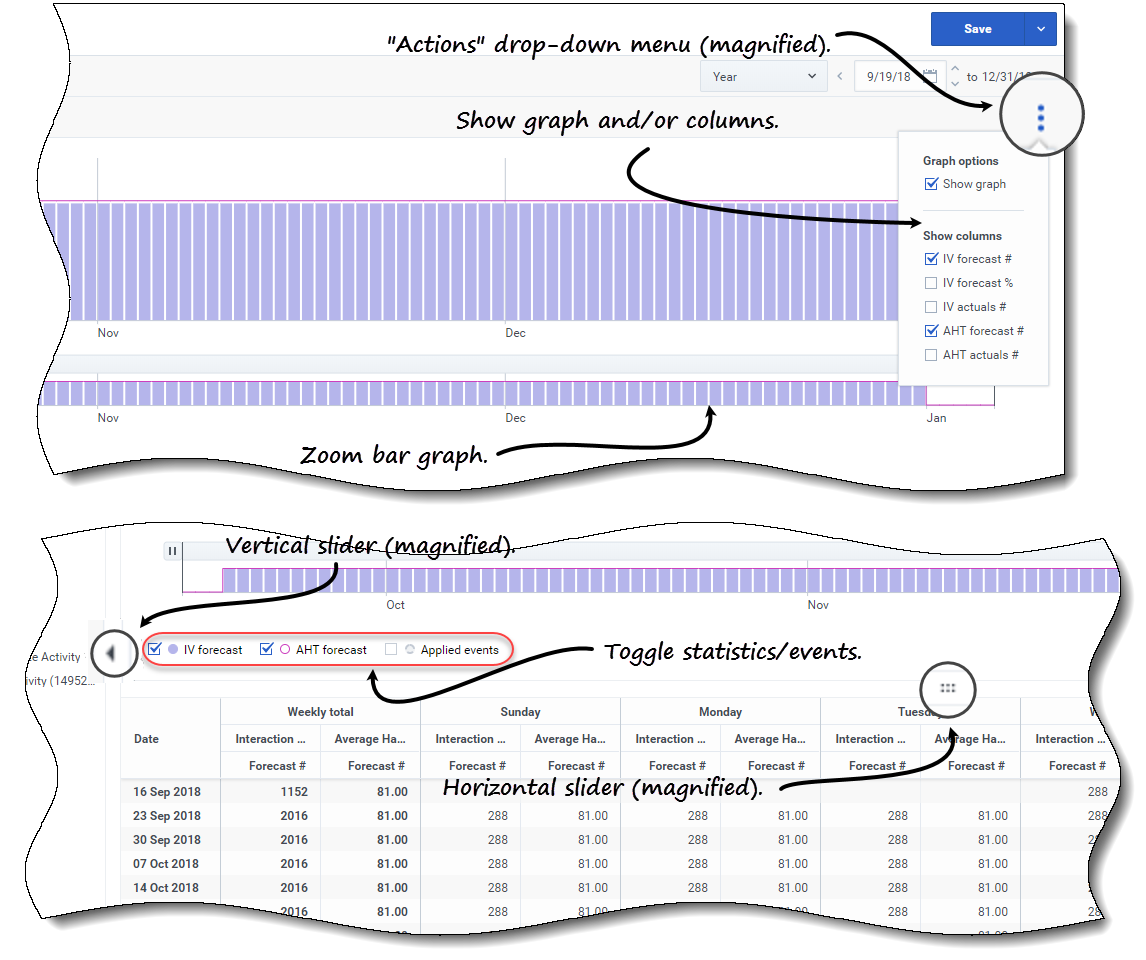
 Actions drop-down menu—Click this icon to change the graph and/or table:
- Graph options—Show/hide the graph and zoom bar by selecting/clearing the Show graph check box. See also Sliders.
- Show columns—Show/hide data columns in the table by selecting/clearing the following check boxes:
- IV forecast #
- IV forecast %
- IV actuals #
- AHT forecast #
- AHT actuals #
- Click anywhere in the view to close the drop-down menu.
- Toggle statistics/events check boxes—Below the graph, toggle a statistic or applied events on or off. Selecting the check box or clicking the radio button toggles it on, displaying the primary statistic as bars, the secondary statistic as a red line, and applied events as a striped orange line. Clearing the check box or clicking the radio button toggles it off, making the statistic or event invisible in the graph. When turned on, the primary statistic's radio button is light blue and the Applied events button is yellow.
Watch the video demonstrating how following features (described here and shown in the graphics above) work. The Smooth graph feature described in the first half of the video is not available In the Master Forecast views:
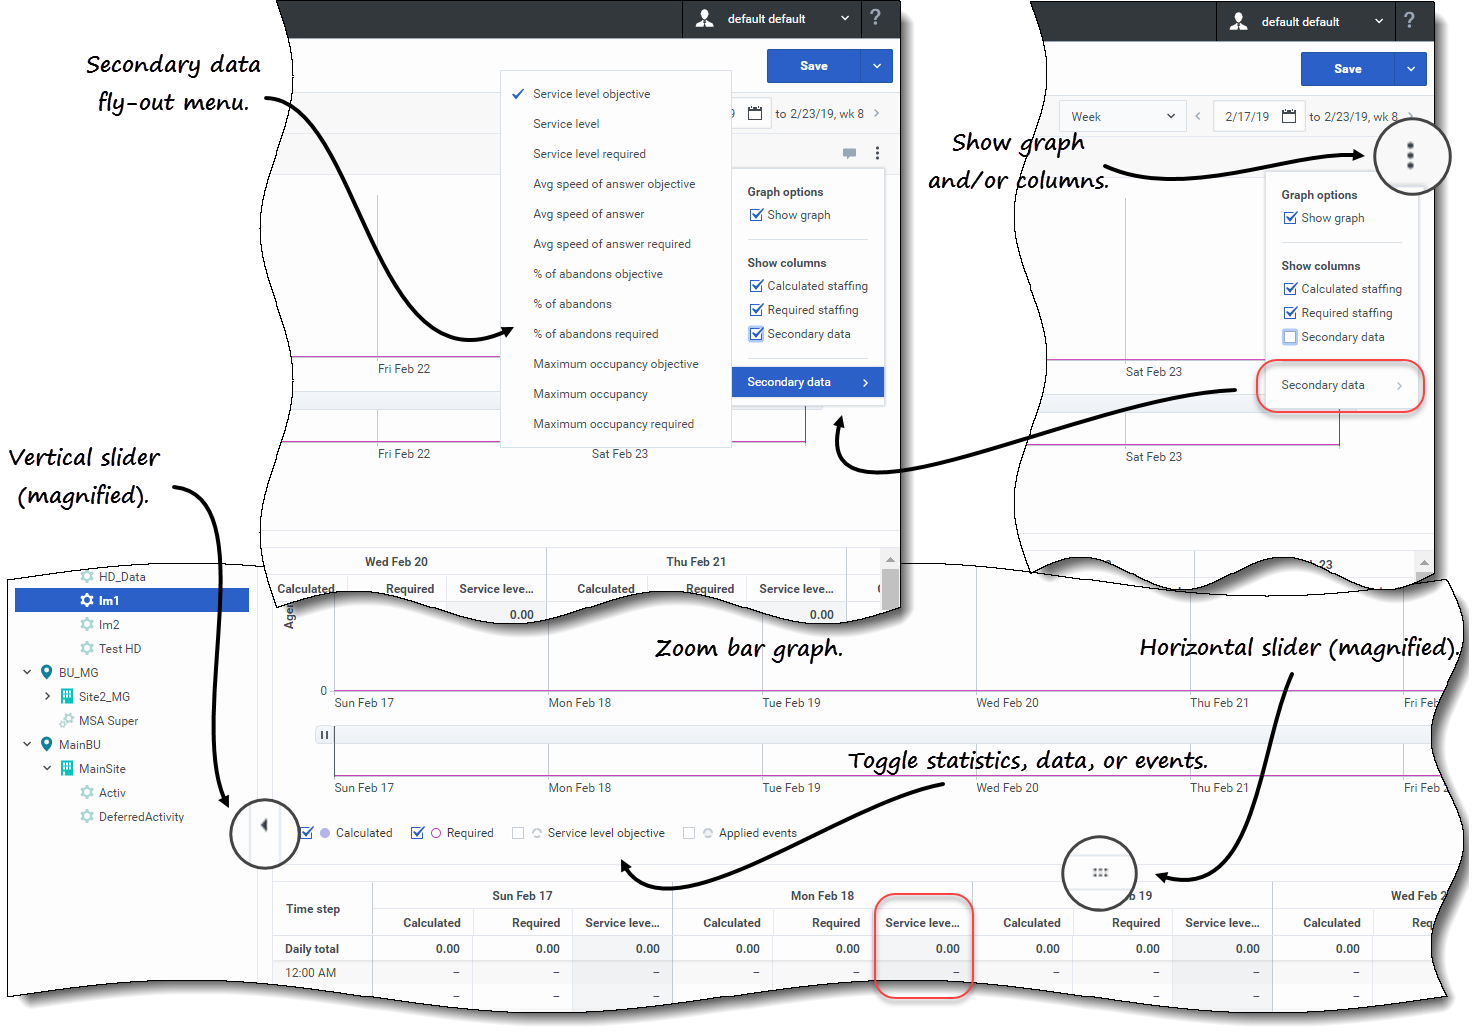
- Sliders—Drag the vertical slider left/right to show/hide the graph, zoom bar, grid and/or Objects pane. Click the arrows in the vertical slider to resize the Objects pane. Drag the horizontal slider up and down to show/hide the graph or grid.
- Zoom bar graph—Use the zoom bar handles to narrow/widen the focus in the graph, by sliding the handle left/right. You can zoom to a minimum of one day. After narrowing the focus, place your cursor over the graph and change the range of the zoom by dragging and dropping it to the left or right. For example, if you narrow the focus to Sunday, Monday, and Tuesday, but want to change it, drag and drop the zoom to the right to Tuesday, Wednesday, Thursday.
Reading the volumes data
The graph shows the statistics, dates, period, and granularity that you selected above. The vertical axis indicates the primary statistic on the left and the secondary statistic on the right. The horizontal axis indicates the different units for the two statistics.
To understand the volumes data, see Reading the data in the Scenario > Volumes topic.Editing the volumes data
In the Master Forecast > Volumes grid, WFM enables you to edit values in the Actual columns only (Actual IV and Actual AHT). You can edit timesteps and daily totals when the selected period is Week and edit weekly and daily totals when the selected period is Month or Year.
You must have the Forecast access privilege Edit Historical Data to edit values in the Actual columns.
When changing the period, granularity, and/or values in the grid, note that daily totals are aggregated values for a 24-hour period. This means the daily and weekly totals automatically adjust and are redistributed according to the original distribution of volume for each day of the week or week of the month/year.
Find information about editing modes and see the editing procedure in Editing data in the grid in the Scenarios > Volumes topic.Copying and pasting the volumes data
In the Master Forecast > Volumes grid, WFM enables you to copy and paste values to/from the actual columns only (Actual IV and Actual AHT). When selecting data for pasting, if you select cells in non editable columns, such as IV Forcasted #, only the cells in Actuals # columns are pasted.
You must have the Forecast access privilege Edit Historical Data to copy/paste data in this view.
For more information about copying and pasting volumes data, see Selecting data to copy and paste.
Viewing the staffing data
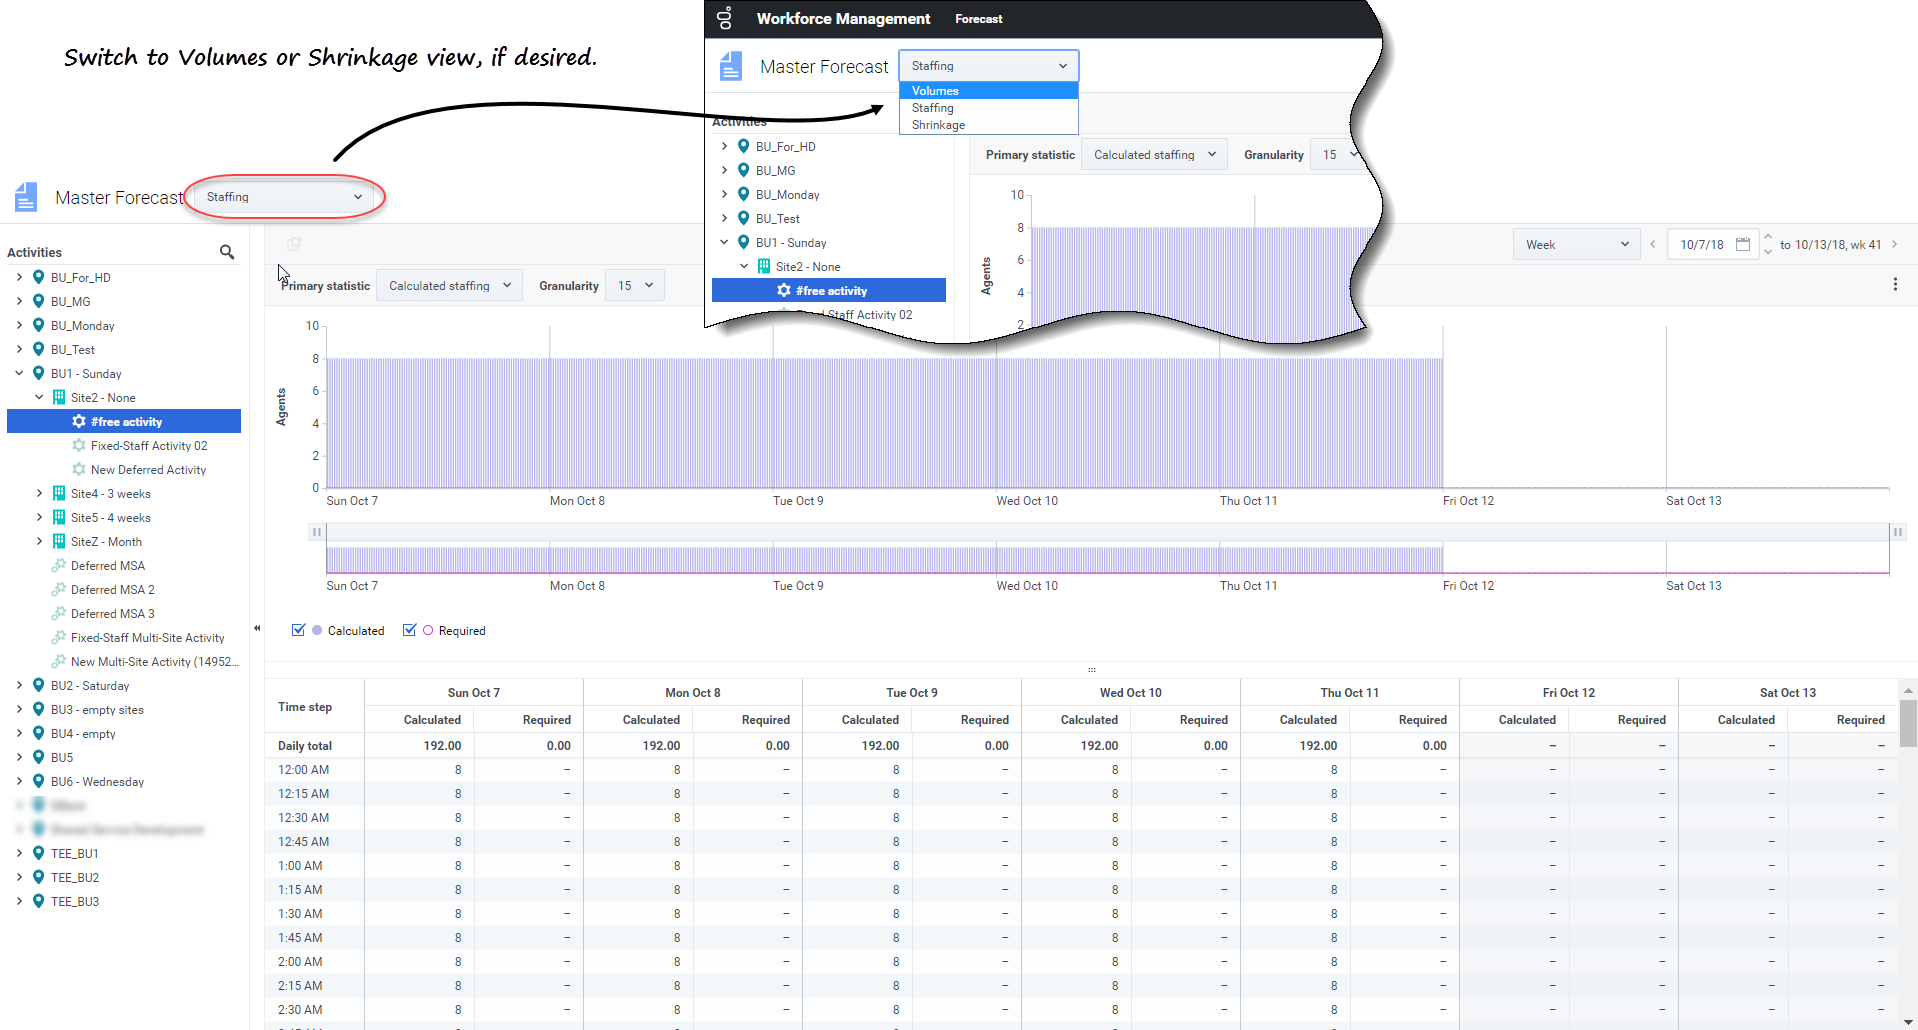
Use the Forecast Staffing view in the Master Forecast to display the required and calculated staffing data. This view provides standard date-selectors and a grid that shows statistics for days or timesteps.
Opening the Staffing view in the Master Forecast
- In the navigation bar, select Forecast > Staffing.
- In the Objects tree, expand a business unit to select a site, activity, or multi-site activity.
The view displays a graph above a table, each containing the same statistics and controls that set the data display properties.
If you do not see any staffing data, you can adjust the Period drop-down list, the sliders (below the graph), or the Granularity and date-selectors at the top of the window to reflect those used for the forecast.
The grid displays open hours for selected site activities and multi-site activities in the same way.
You can view the volumes or shrinkage data in the Master Forecast, by selecting Volumes or Shrinkage from the drop-down list in the top-left corner of this view.
Setting the data display properties
In this view, use the following controls to customize the data display:
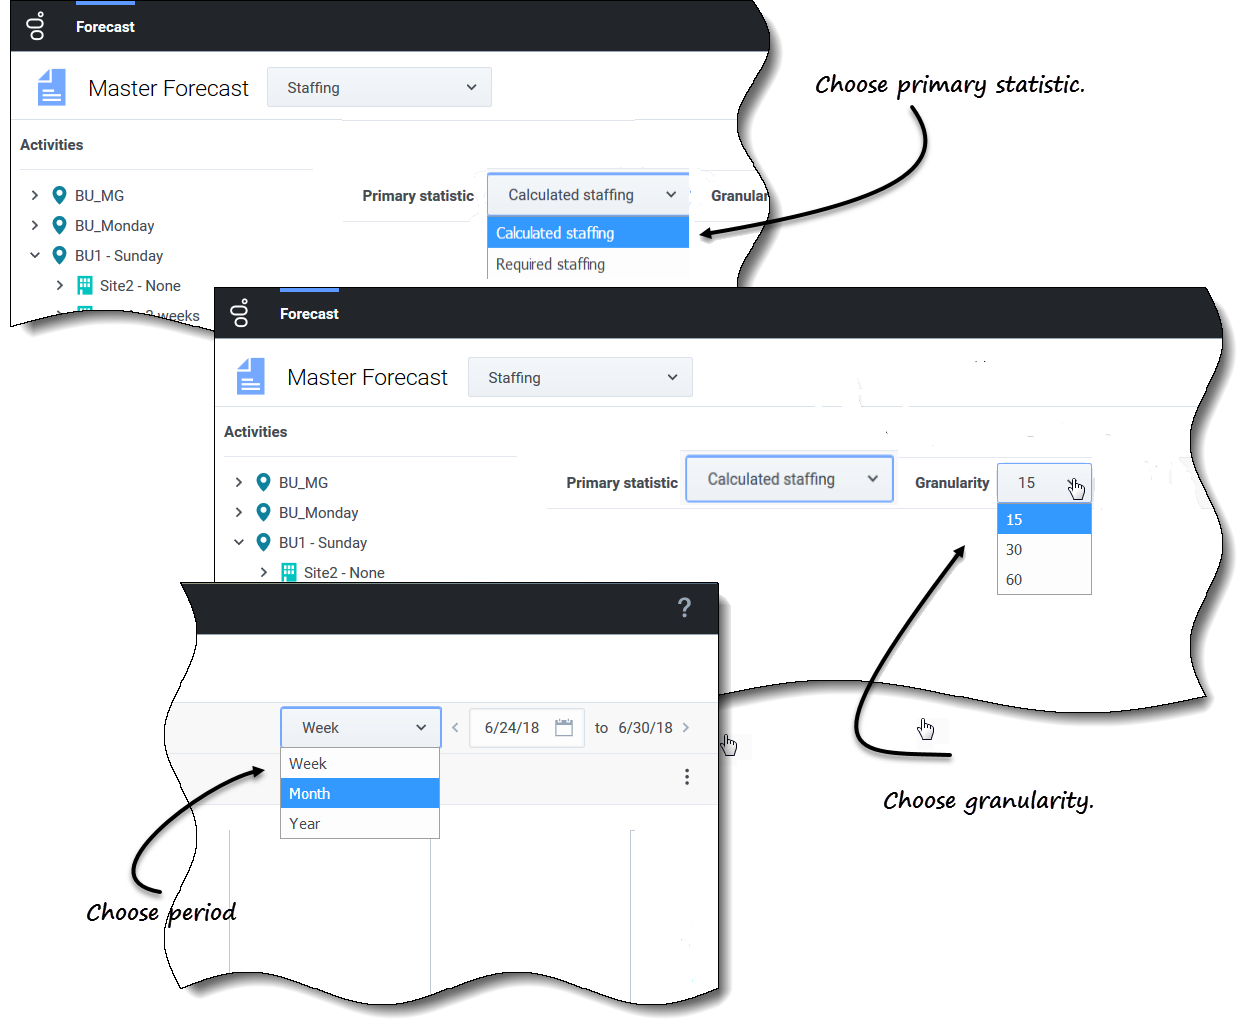
- Primary statistic drop-down list—Select the statistic that will be displayed as primary, by selecting Calculated staffing or Required staffing. The primary statistic displays as a bar in the graph and the secondary statistic displays as a red line.
- Granularity drop-down list—Select Month or Year to adjust the granularity to Day. Select Week to adjust the granularity to 15, 30, or 60 (minutes).
- Period drop-down list—Change the period or time range for the graph and grid by selecting Year, Month, or Week. If the selected site has a configured planning period, you can also select Planning Period.
- Date range—Use the date-selectors (top-right portion of the view) to switch to a different period within the scenario forecast's date range.
 Actions drop-down menu—Click this icon to change the graph and/or table:
- Graph options—Show/hide the graph and zoom bar by selecting/clearing the Show graph check box. See also Sliders.
- Show columns—Show/hide data columns in the grid by selecting/clearing the Calculated staffing, Required staffing or Secondary data check boxes.
- Secondary data—Click this item to open a fly-out menu that list all of the secondary data types that can be displayed in the graph and grid.
- If Secondary data is checked in the Show columns section, the data type that you select from the fly-out menu is the name of the column that displays in the grid and the radio button/check box below the graph, and it displays as the y-axis statistic. To learn more, see Viewing the staffing secondary data.
- Click anywhere in the view to close the drop-down menu.
- Toggles check boxes—Below the graphic, toggle a statistic (Calculated, Required, Secondary data), or Appliled Events on or off in the graph. Selecting the check box or clicking the radio button toggles it on, and clearing the check box or clicking the radio button toggles it off. When checked, the radio button is:
- solid blue for Calculated.
- outlined in magenta for Required.
- outline in a broken purple line for Secondary data.
- outlined in a broken yellow line for Applied events.
Watch the video demonstrating how the Sliders and Zoom bar graph (shown in the graphics above) work. The Smooth graph feature described in the first half of the video is not available In the Master Forecast views:
Reading the staffing data
The graph shows the staffing, dates, period, and granularity that you selected above. The vertical axis indicates the number of agents staffed. The horizontal axis displays different units for the staffing data.
To read and understand the staffing data, see this same to Reading the data in the Scenario > Staffing topic.
Viewing the staffing secondary data
In the Master Forecast > Staffing view, you can view secondary data in the graph and grid, in any granularity (Day, 15, 30, 60 minutes) and for any period (Week, Month, Year). Note that the secondary data column in the grid is read-only, and fixed-staff activities and multi-site activities do not have secondary data.
Displaying and viewing secondary data in the Master Forecast > Staffing view is the same as in Viewing secondary data in the Scenarios Staffing topic.
Editing the staffing data
In the Master Forecast views, if you select the period Year or Month, you can click inside the Weekly Totals cells in the grid and edit the value there. Find information about editing modes and see the editing procedure in Editing data in the grid in the Scenarios > Staffing topic.
Copying and pasting the staffing data
In the Master Forecast > Staffing grid, WFM enables you to copy values from the Calculated and Required columns and paste them to external documents, such as Excel or Notepad. You cannot paste data in this view.
For more information about copying and pasting staffing data, see Selecting data to copy and paste.
Viewing shrinkage data
Use the Forecast Shrinkage view in the Master Forecast to display the overhead data, which WFM uses to forecast shrinkage while scheduling. This view provides standard date-selectors and a grid that shows statistics for days or time steps.
Opening the Shrinkage view in the Master Forecast
- In the navigation bar, select Forecast > Shrinkage.
- In the Objects tree, expand a business unit to select a site, activity, or multi-site activity.
If you do not see any shrinkage data, you can adjust the Period drop-down list, the sliders (below the graph), or the Granularity and date-selectors at the top of the window to reflect those used for the forecast.
The grid displays open hours for the selected site activities and multi-site activities in the same way.
You can view the volumes or staffing data in the Master Forecast, by selecting Volumes or Staffing from the drop-down list in the top-left corner of this view.
Setting the data display properties
In this view, use the following controls to customize the data display:
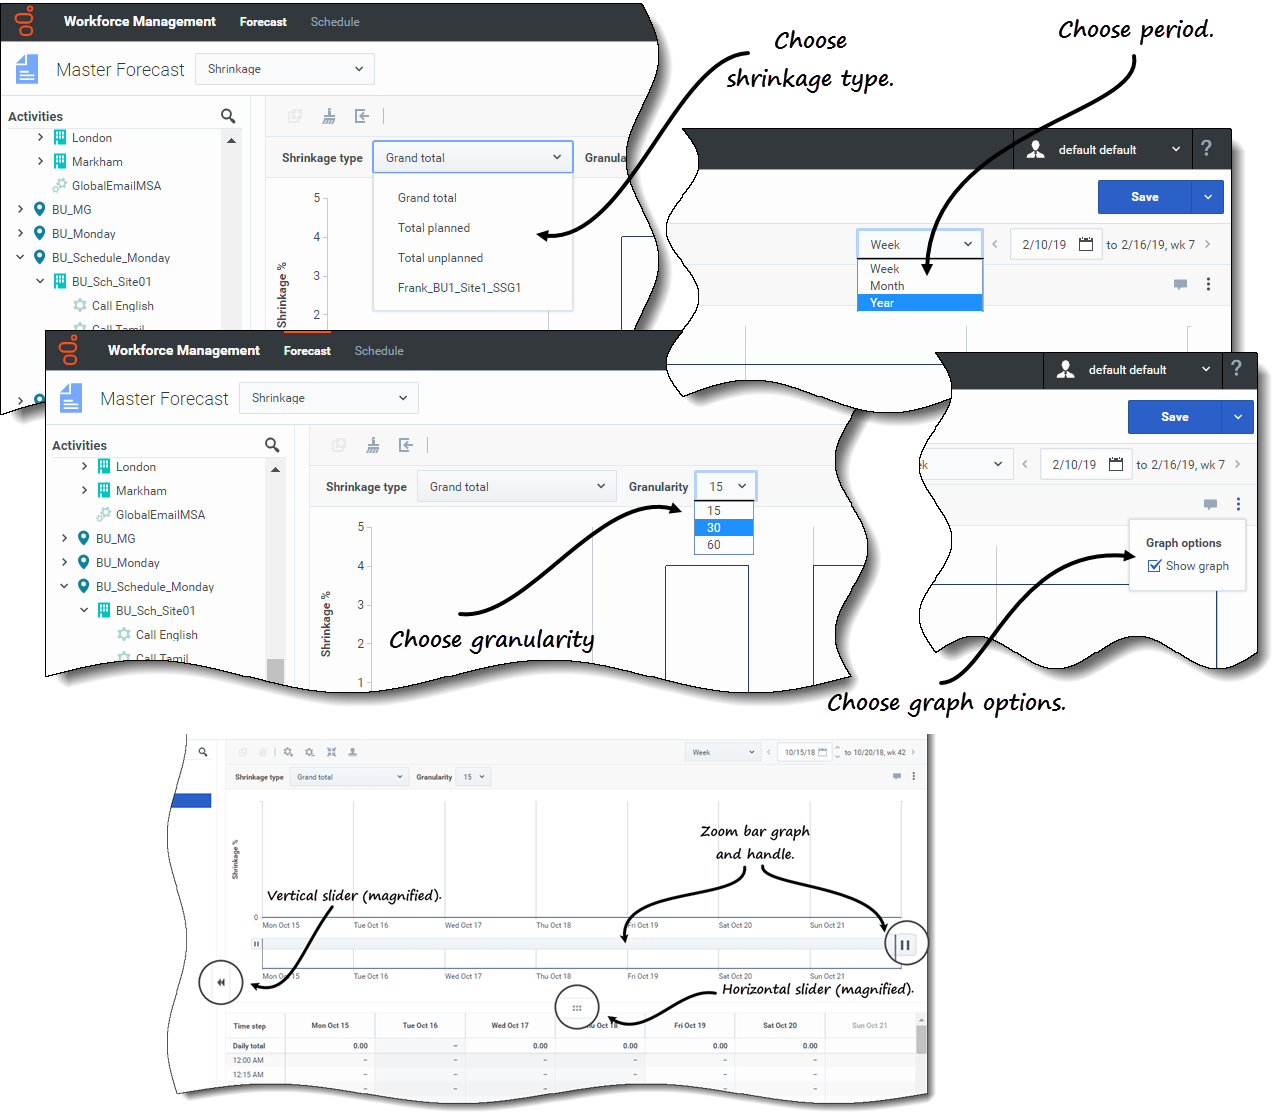
- Shrinkage type drop-down list—Select the shrinkage type to be displayed by selecting Grand total, Total planned, or Total unplanned.
- Period drop-down list—Change the period or time range for the graph and grid by selecting Year, Month, or Week. If the selected site has a configured planning period, you can also select Planning Period.
- Granularity drop-down list—Adjust the granularity to Day if you selected Month or Year in the Period drop-down list. Adjust the granularity to 15, 30, or 60 (minutes) if you selected Week in the Period drop-down list.
- Date range—Use the date-selectors (top-right portion of the view) to switch to a different period within the scenario forecast's date range.
 Actions drop-down menu—Click this icon to change the graph and/or table:
- Graph options—Show/hide the graph and zoom bar by selecting/clearing the Show graph check box. See also Sliders.
Watch the video demonstrating how the Sliders and Zoom bar graph (shown in the graphics above) work. The Smooth graph feature described in the first half of the video is not available In the Master Forecast views:
Reading the shrinkage data
The graph shows the shrinkage type, date, period, and granularity that you selected above. The vertical axis indicates the shrinkage percentage. The horizontal axis displays different units for the shrinkage.
To understand the shrinkage data, see Reading the data in the Scenarios > Shrinkage topic.
Editing the shrinkage data
In the Master Forecast views, if you select the period Year or Month, you can click inside the Weekly Totals cells in the grid and edit the value there. Find information about editing modes and see the editing procedure in Editing data in the grid in the Scenarios > Shrinkage topic.
Copying and pasting the shrinkage data
In the Master Forecast > Shrinkage grid, WFM enables you to copy values from the columns in the grid and paste them to external documents, such as Excel or Notepad. You cannot paste data in this view.
For more information about copying and pasting shrinkage data, see Selecting data to copy and paste.
Finding events in forecasts
Find events for an activity or multi-site activity quickly by using the Find Events search dialog, available only in the Master Forecast > Volumes view.
When a Find Events search is initiated, WFM searches through historical data for any period of time that represents an anomaly. For example: imagine that the AHT on May 24, 2008, between 8 p.m. and 9 p.m. was 500% higher than on the historical norm for those hours. The Find events search dialog can quickly locate this anomaly in the historical data for you when it might otherwise be hard to find.
The Find events dialog opens with Possible events selected by default and contains the default values for the statistic, granularity, and start and end dates based on the Master Forecast Volumes primary statistic, granularity, and date range. You can change any of these default settings.
Understanding event types
This Help mentions three types of events, as follows:
- Applied Events—You apply these when you are building volumes. These events are equal to or a subset of Existing events.
- Existing Events—You define or add these in the Overlays view.
- Possible Events—WFM calculates these using the Find events feature (described in this topic), based on historical data.
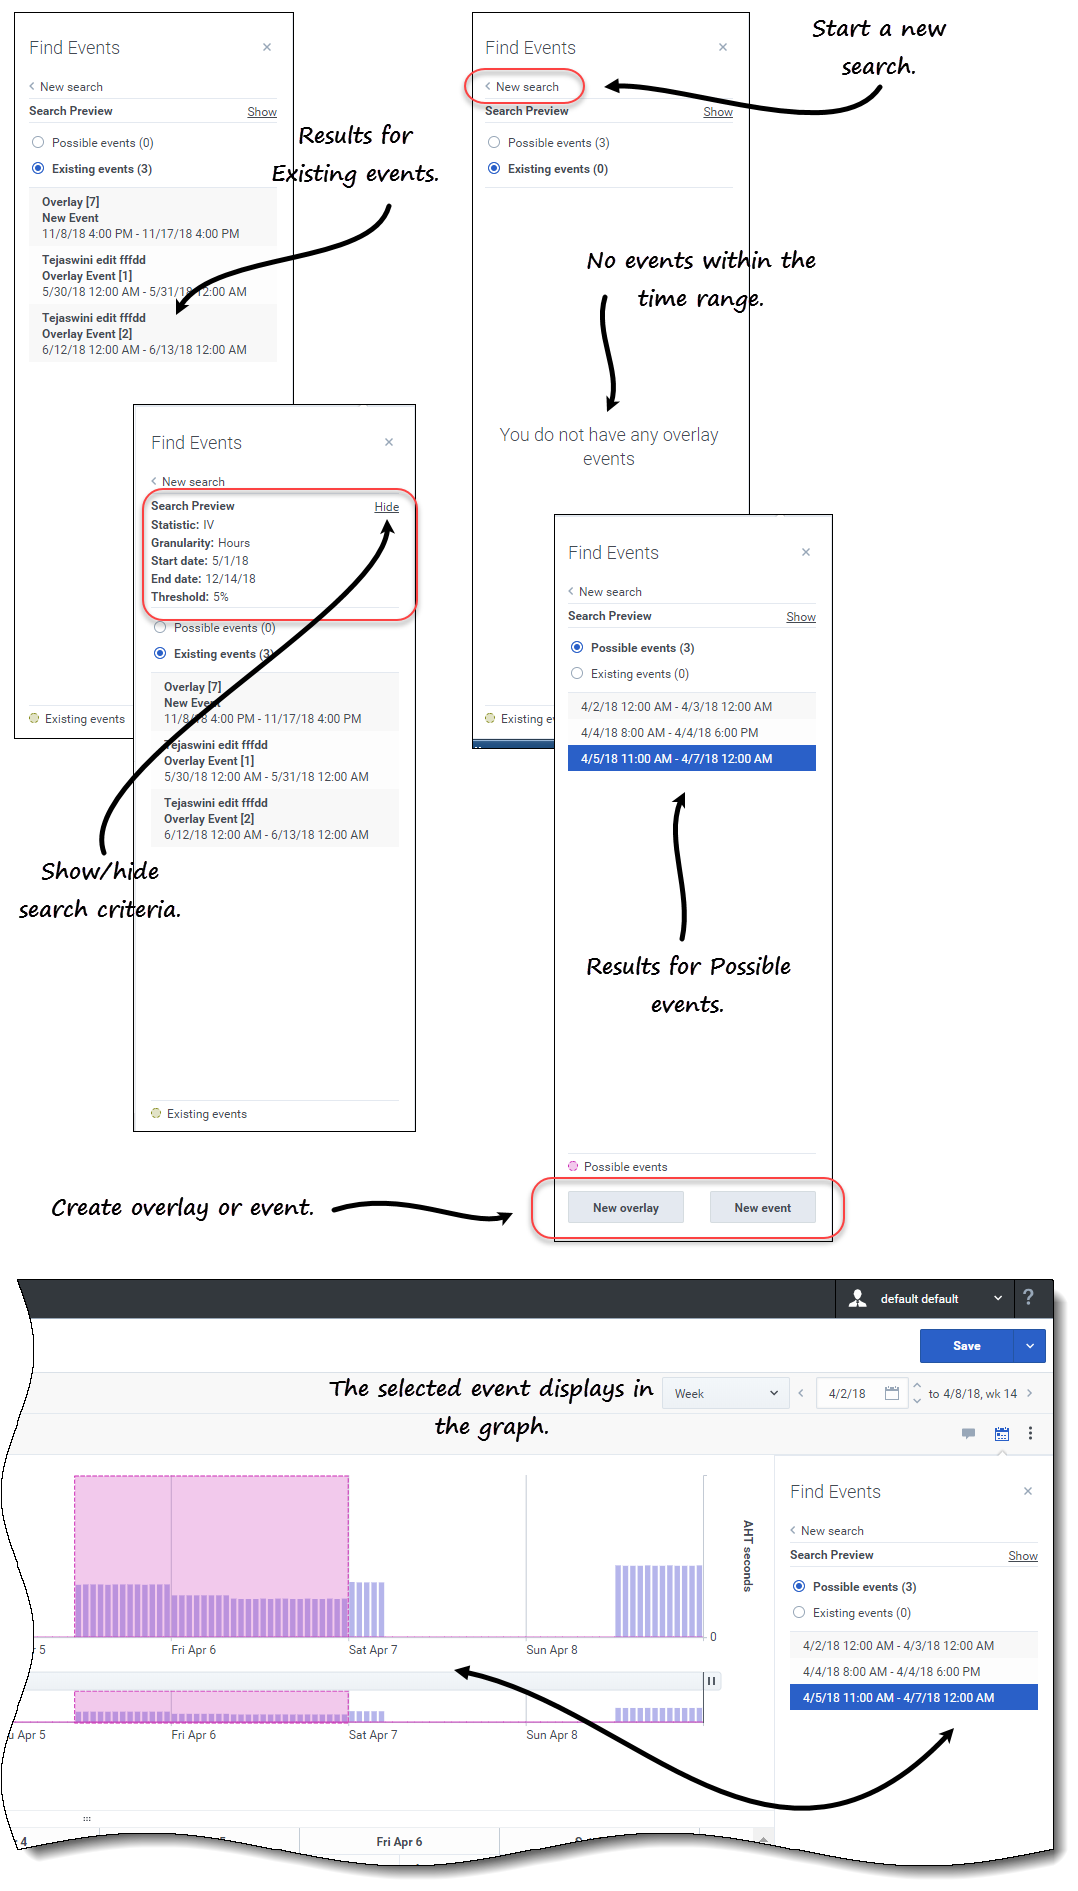
When selected in the results pane, Possible events appear in a yellow bar graph and Existing events appear in a striped pink bar graph.
Events can sometimes overlap. When this happens, hover your cursor over the overlapping area or non-overlapping area to display the event name and date.
Finding events in a forecast
- Open the Master Forecast.
- In the Volumes view, expand business units and sites in the Objects pane and select an activity or multi-site activity.
- Below the date range, in the toolbar, click Find events
 .
.
- The Find events dialog opens.
- Retain the defaults, or select the Data type (IV, AHT) and Granularity (Daily, Hourly) on which to search.
- Retain the defaults, or select a Start date and End date.
- Enter the Threshold percentage (between 1 and 1000).
- This is the percentage of deviation from historical data, that would identify the event you want to locate.
- Click Find events.
- When WFM completes the search, the dialog displays the results in two categories with the number of events found in brackets:
- Possible events (<n>)
- Existing events (<n>)
- Click either one of the radio buttons to see the result for that category.
Items in both results list display in the format <start date and time - end date and time>. Existing events items also show the event name above the date/time range.
Selecting an event in either list changes the primary statistic, granularity, and date range in the toolbar, if applicable. If there are no events to display, you'll see the message You do not have any overlay events.
In the results dialog, you can also:
- Start a new search, by clicking the arrow (<) beside New search.
- Show/hide the search criteria in the results dialog by clicking Show or Hide.
- Create an overlay, by clicking New overlay (enabled only if Possible events is selected).
- This action opens the New Overlay wizard.
- Create an event, by clicking New event (enabled only if Possible events is selected).
- This action opens the New Event wizard. It contains a list of overlays and default values that are based on the search criteria. New events appear in the existing events list if it falls within the date range. If you enter an event name that already exists, WFM displays an error message in the New Event dialog.
- Close the dialog, by clicking the X in the upper-right corner.
- Cancel the search, by clicking Cancel or X in the upper-right corner of the progress dialog. WFM preserves your selections in the Find events dialog.
Cleaning up data in the forecast
From time to time, you might need to remove information from the Master Forecast for specific dates, activities, or multi-site activities (MSA). WFM simplifies this task by providing the Cleanup feature in all three Master Forecast views. You can clean up data for one or more business units, sites, activities, or MSA.
Removing data from Master Forecast for a specified date range
- Open a view in the Master Forecast (Volumes, Staffing, or Shrinkage).
- Click Cleanup.
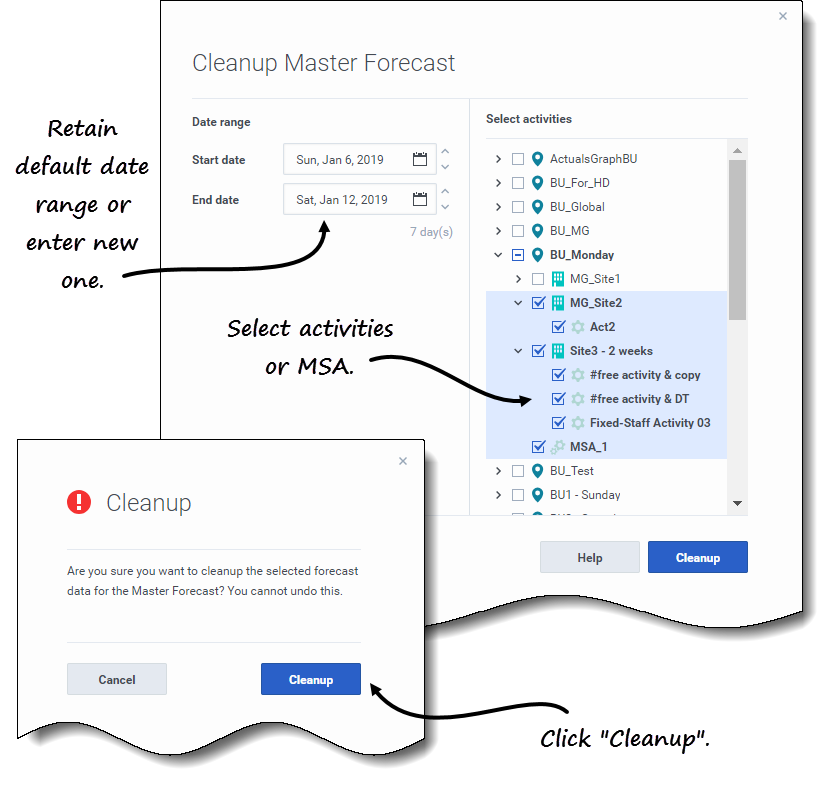
- The Cleanup Master Forecast dialog opens.
- In the Start date and End date fields, enter (or select from the calendar) the range of dates for which you want to remove data.
- Expand the tree to select the business units, sites, activities, or MSA for which you want to remove data.
- Click Cleanup.
- In the Cleanup dialog, if you are sure you want to complete this action, click Cleanup.
- When the dialog indicates that the process is complete, click OK.
Click Cancel or X in the upper-right corner at any point to close the dialog without changing the Master Forecast.
Using the toolbar
You can use the following buttons on the toolbar in all Master Forecast views:
| Icon | Name | Description |
|---|---|---|
| Copy | Copies data selected in the grid to the clipboard. | |
| Cleanup | Opens the Cleanup Master Forecast dialog, enabling you to remove data from the Master Forecast for selected dates, activities, or multi-site activities. |

