Volumes in scenarios
Contents
Learn about the types of data you'll find in the Volumes grid, how to navigate it, and customize it.
In Workforce Management (WFM), you'll use the Scenarios Volumes view to build or edit the selected forecast scenario's interaction volumes and average handle times. This view provides a graph and grid that shows statistics for a specified time period and standard date-selectors.
Viewing the volumes data
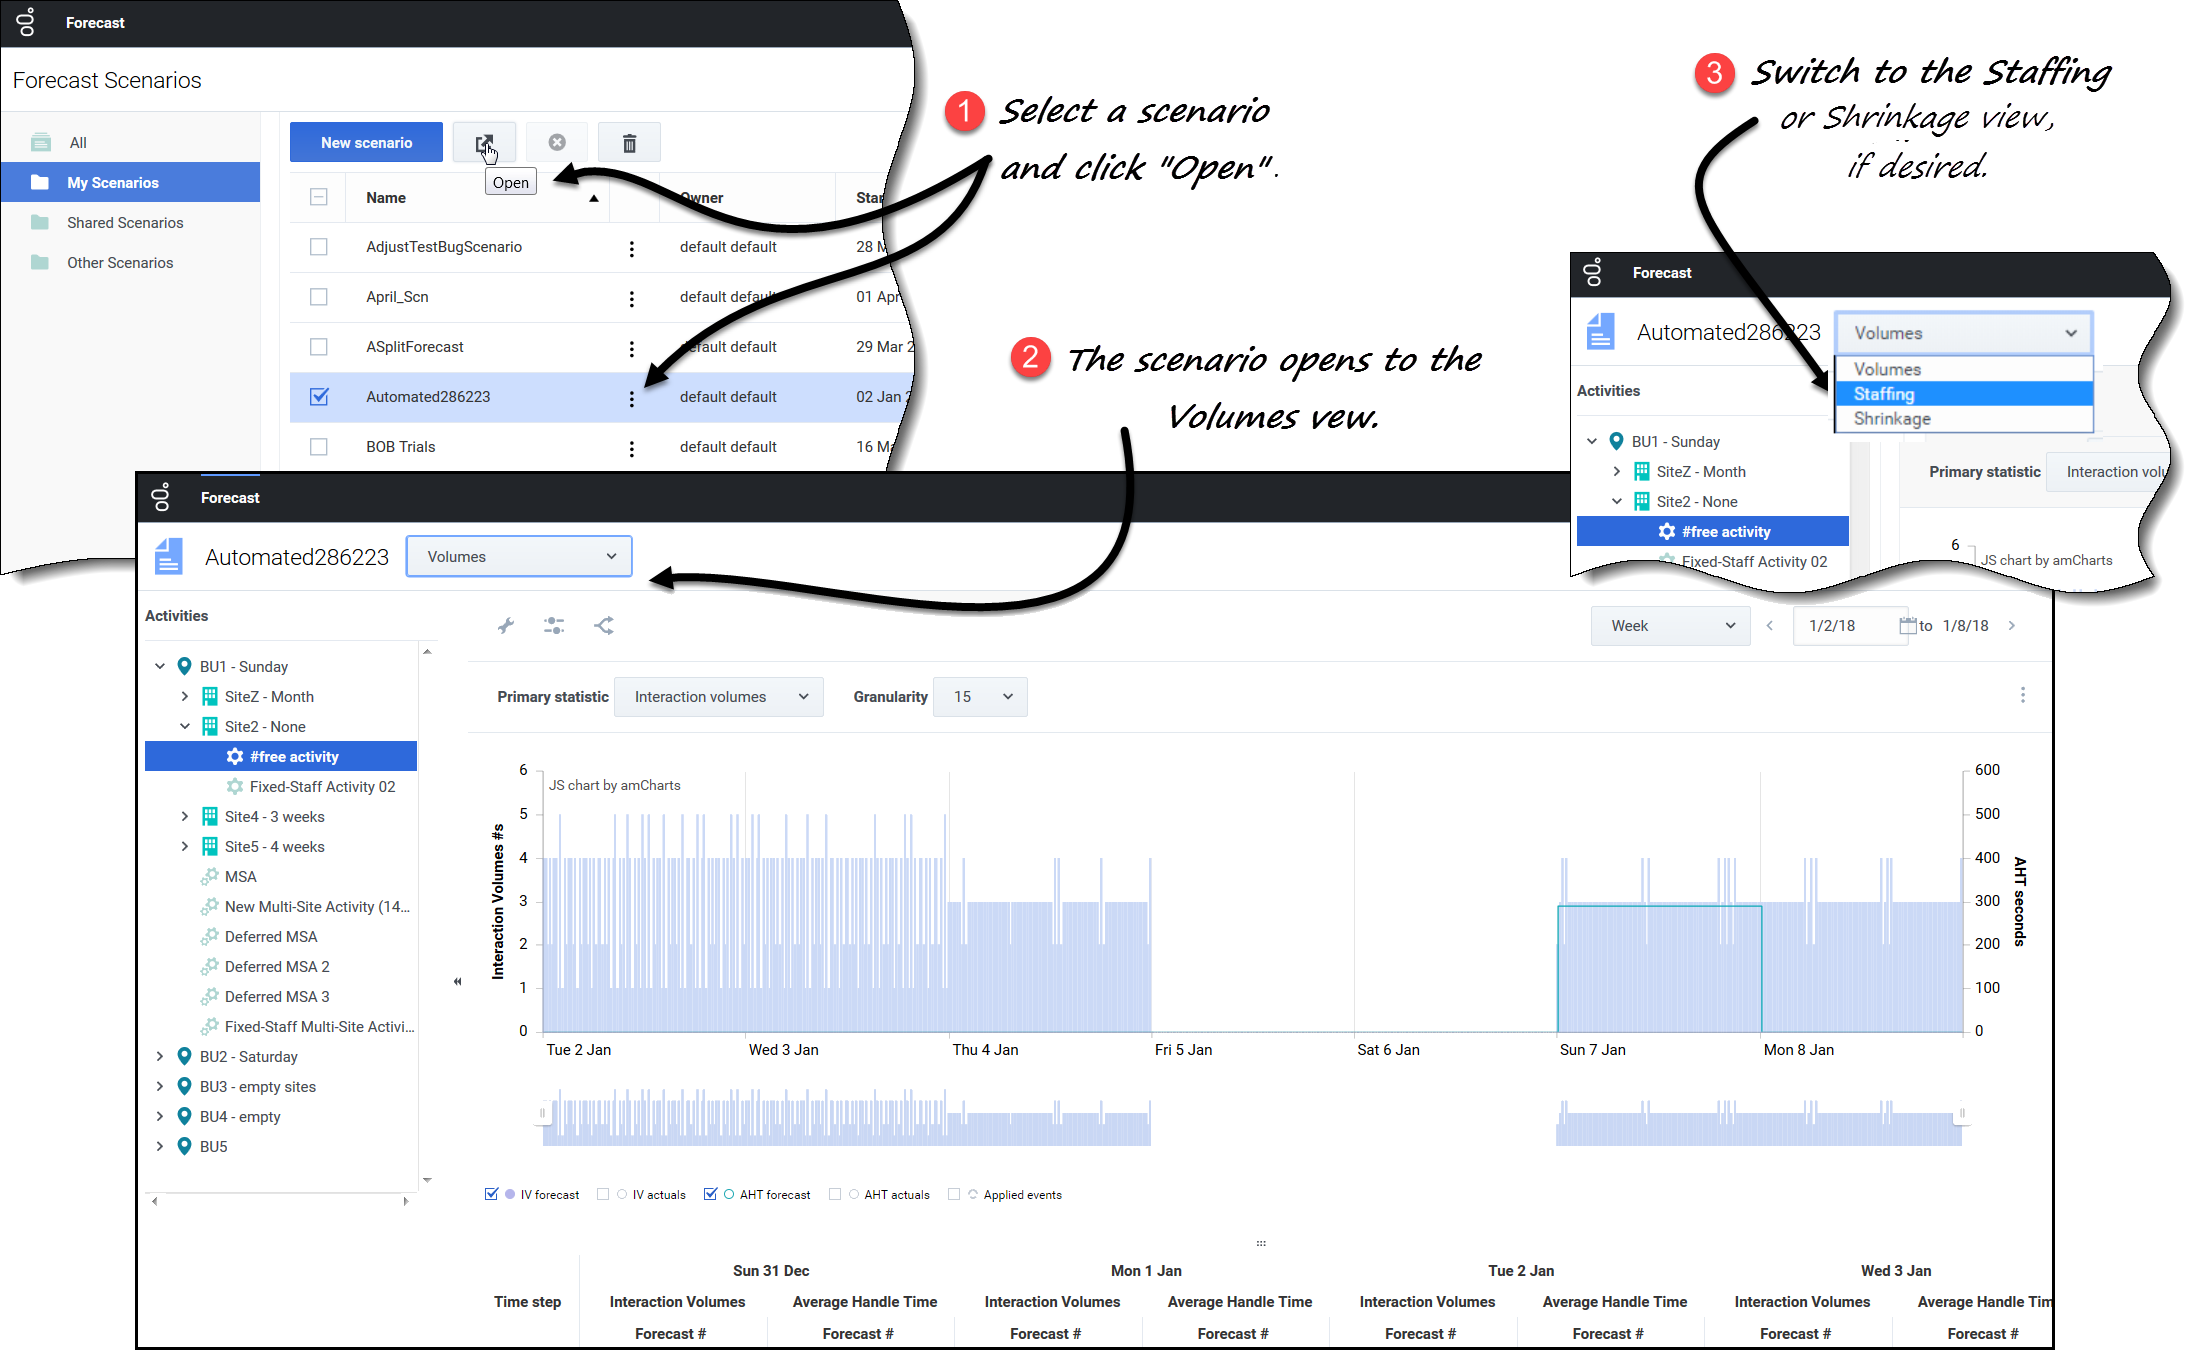
Scenarios open to the Volumes view where you can view, build, or edit the volumes data. When you select an object in this view, the start date is determined by the selected business unit's week start day setting, regardless of your locale settings. Watch the video.
Opening the Volumes view
- In the Forecast module, select Scenarios.
- Select a scenario from the list in the data pane, and click Open in the toolbar or in the Actions
 drop-down menu.
- The Volumes view opens with the scenario name in the top-left corner of the window.
- In the Objects tree, select an activity, multi-site activity, site, or business unit.
- The view displays a graph above a table, each containing the same statistics and controls that set the data display properties.
If you do not see any forecast data, you might have to adjust the Period drop-down list, the sliders (below the graph), or the Granularity and Date controls at the top of the window to reflect those used for the forecast.
The grid displays open hours for selected site activities and multi-site activities in the same way.
You can also view, add, and edit the staffing or shrinkage data in opened scenarios, by selecting Staffing or Shrinkage from the drop-down menu near the scenario name.Setting the data display properties
In this view, the graph's y-axis represents the values for the selected statistic (IV or AHT); the x-axis represents the selected period (week, month, or year).
See the following controls to customize the data display in the graph and table:
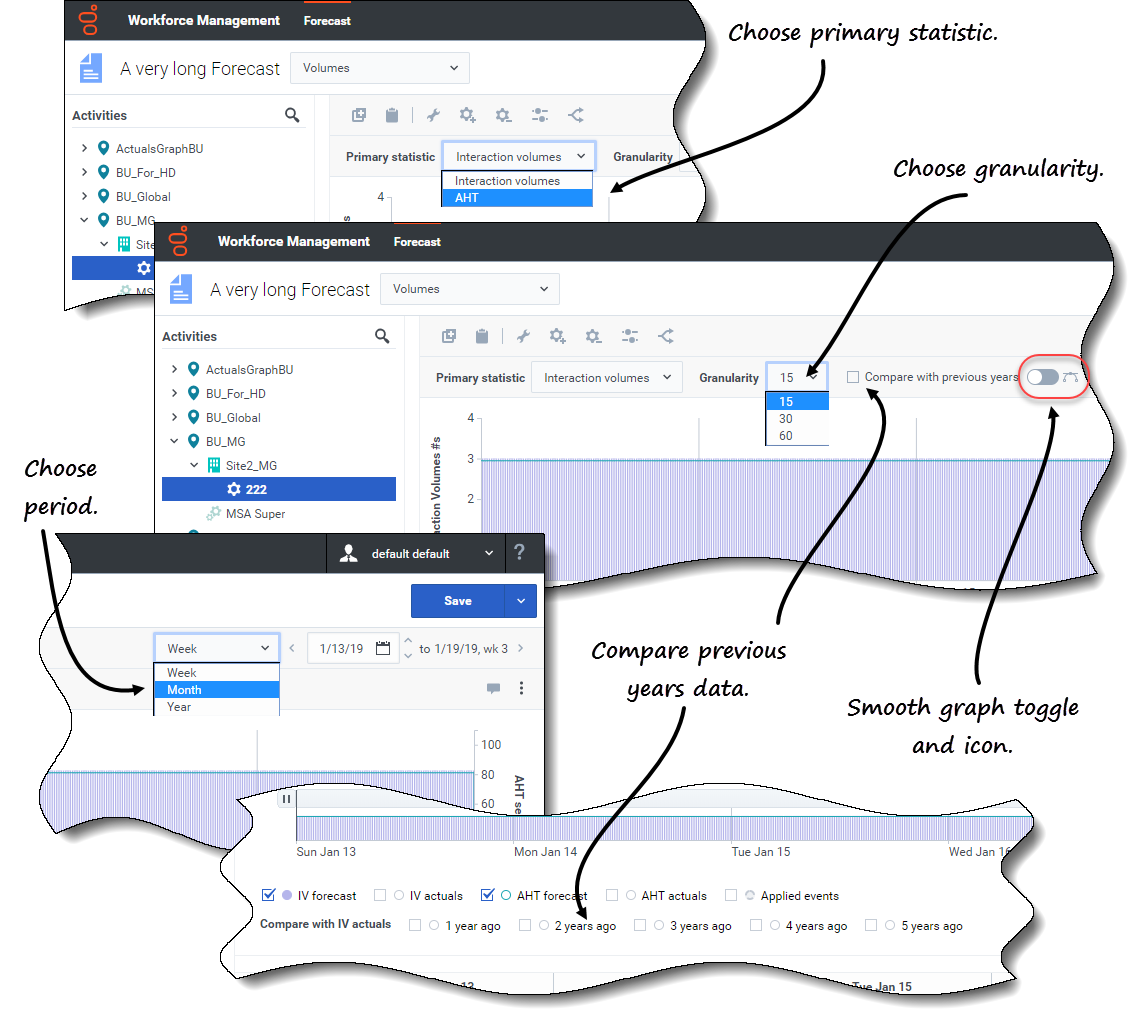
- Primary statistic drop-down list—Select the statistic that will be displayed as primary, by selecting Interaction Volumes (IV) or AHT (average handle time). The primary statistic displays as a bar in the graph and the secondary statistic displays as a line.
- Period drop-down list—Change the time range for the graph and grid by selecting Year, Month, or Week.
- Granularity drop-down list—Adjust the granularity to Day if you selected Month or Year in the Period drop-down list. Adjust each row's time range by selecting 15, 30, or 60 (minutes) from this list if you selected Week in the Period drop-down list.
- Compare with previous years check box—Check to compare the IV or AHT data to the historical IV or AHT data, based on the primary statistic. When checked, WFM displays more check boxes below the smooth graph, enabling you to compare IV or AHT data to data from 1 - 5 years ago. See more about historical data here.
- Date range—Use the date-selectors (top-right portion of the view) to switch to a different period within the scenario forecast's date range. The week number is also displayed here when the selected period is Week.
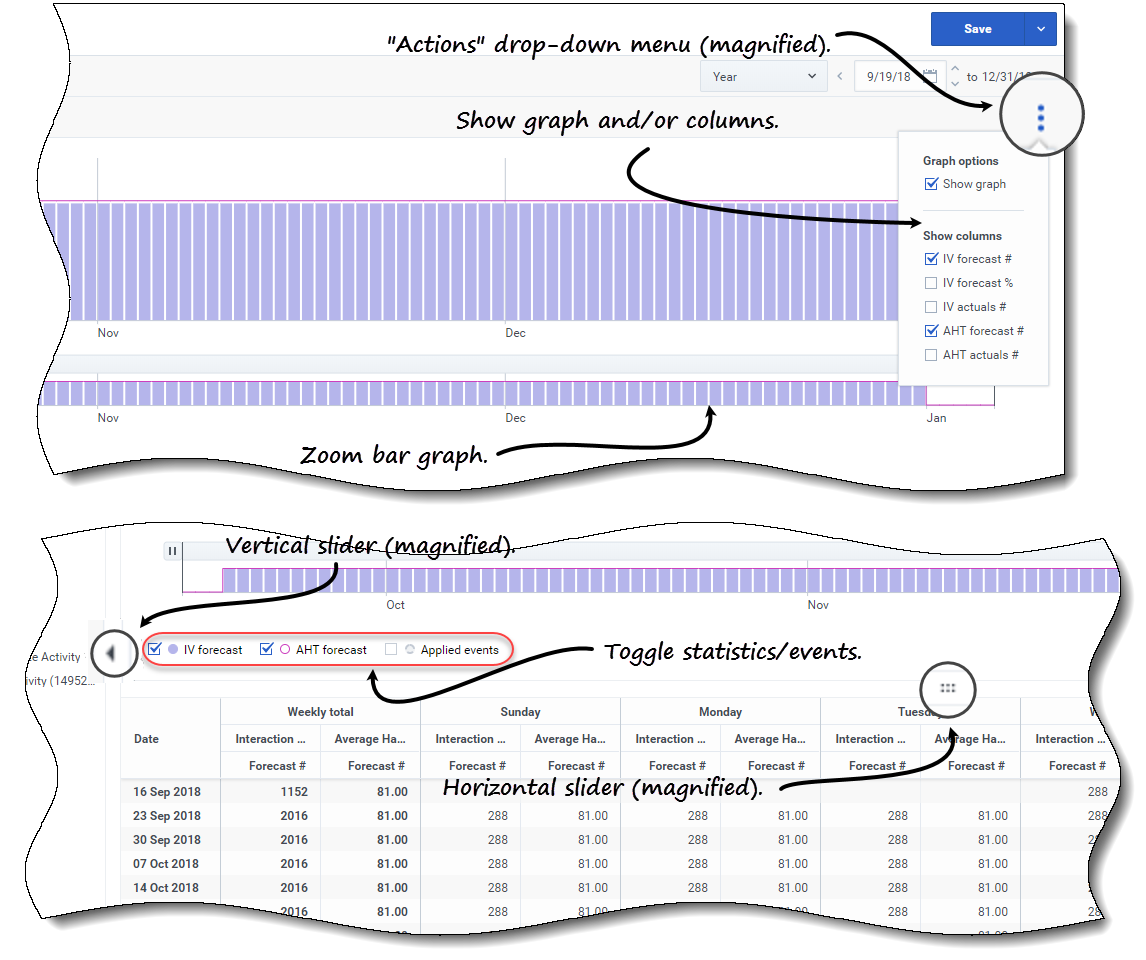
 Actions drop-down menu—Click this icon to change the graph and/or table:
- Graph options—Show/hide the graph and zoom bar by selecting/clearing the Show graph check box. See also Sliders.
- Show columns—Show/hide data columns in the table by selecting/clearing the following check boxes:
- IV forecast #
- IV forecast %
- IV actuals #
- AHT forecast #
- AHT actuals #
- Click anywhere in the view to close the drop-down menu.
- Statistics/Applied events check boxes—Below the graph, toggle a statistic or applied events on or off. Selecting the check box or clicking the radio button toggles it on, displaying the primary statistic as bars, the secondary statistic as a red line, and applied events as a striped orange line. Clearing the check box or clicking the radio button toggles it off, making the statistic or event invisible in the graph. When turned on, the primary statistic's radio button is light blue and the Applied events button is yellow.
For single-day events, the striped orange line covers the start of the day to the end of the day—Even when you zoom in the graph. For multi-day events, the striped orange line covers the event start date to the event end date. Hovering over the event in the graph opens a tooltip that shows the event name and date.
Event types, including Applied events, are defined in Understanding event types.
Using the graph, zoom bar, and sliders
Watch the video to see a demonstration of the features in the Volumes views, shown in the graphics above and described here:
 Smooth graph button and icon—Edit the bar graph (using the button or icon) when an activity is selected in the Objects pane and this feature is toggled on.
- The bars representing the primary statistic come to the front of the graph and become bold, the line representing the secondary graph fade to the background, and the x-axis zoom is disabled.
- Clicking any bar in the graph reveals a handle, enabling you to drag the bar up or down. The corresponding cell in the grid is highlighted and the value increases or decreases as you move the bar graph up and down. Similarly, if you click any cell in the grid and change the value, the corresponding bar graph changes accordingly.
- Dragging the bar to the upper limit of the y-axis increases the y-axis scale, causing the remaining bars to scale down proportionally. If the bars are too narrow to select easily, toggle off the smooth graph and switch your view to another time period or use the Zoom bar.
- Sliders—Drag the vertical slider left/right to show/hide the graph, zoom bar, grid and/or Objects pane. Click the arrows in the vertical slider to resize the Objects pane. Drag the horizontal slider up/down to show/hide the graph and/or grid.
- Zoom bar—Use the zoom bar handles to narrow or widen the focus in the graph, by sliding the handle left or right. You can zoom to a minimum of one day. After narrowing the focus, place your cursor over the graph and change the range of the zoom by dragging and dropping it to the left or right. For example, if you narrow the focus to Sunday, Monday, and Tuesday, but want to change it, drag and drop the zoom to the right to Tuesday, Wednesday, Thursday.
Reading the Data
The grid (below the graph) provides columns that display the following statistics:
- Daily total—If you select the period Week, this row shows daily totals for IV and AHT.
- Weekly total—If you select the period Month or Year, these columns show the weekly totals for IV and AHT.
- Date/Time step—Identifies the range of dates or timesteps in this row. The column name and contents will differ, depending on the period and granularity you selected above.
- [Days or Dates]—If you select the:
- Week date range—Each group of columns indicates one day, the top row shows daily totals, and each lower row shows statistics for one timestep on that date.
- Month date range—Each group of columns shows statistics for one full day.
- Year date range—Each group of columns shows statistics for one full day.
- Timestep duration depend on the granularity that you selected above.
- Interaction Volumes—Shows the interaction volume forecasted for each day or timestep. You can edit the cells' contents, replacing the displayed values with integer values.
- Average Handle Time—Shows the average handling time forecasted for each day or timestep. You can edit the cells' contents, replacing the displayed values with integer values (with two decimal points).
- Compare with IV actuals—Compares actual IV data with historical IV data that was imported or collected. When comparing data to previous years, WFM displays the same weekdays as the actual, irregardless of the selected period (Week, Month Year). For example, if the specified date range is Thursday, Nov 1st 2018 to Friday, Nov 30th 2018:
- If 1 year ago is selected, the actual IV is compare to the historical date range Thursday, Nov 2nd 2017 to Friday, Dec 1st 2017.
- If 3 years ago is selected, actual IV is compare to the historical date range Thursday, Oct 29th 2015 to Friday, Nov 27th 2015.
Editing data in the grid
In the Scenario > Volumes grid, WFM enables you to edit forecast and actual values. You can edit timesteps and daily totals when the selected period is Week and edit weekly and daily totals when the selected period is Month or Year.
When changing the period, granularity, and/or values in the grid, note that daily totals are aggregated values for a 24-hour period. This means the daily and weekly totals automatically adjust and are redistributed according to the original distribution of volume for each day of the week or week of the month/year. This is useful if you have a week in which you believe the volume will be increased, but you expect the volume to arrive at about the same rate as in your original forecast, day-over-day.
Editing IV values
Here are some things to keep in mind when editing IV values in the grid. If you edit the IV Forecast %:
- Time step values—WFM recalculates IV Forecast # and IV Forecast % values for all time steps on days that have IV values greater than 0.
- Daily total values—WFM recalculates IV Forecast # and IV Forecast % values for all time steps on days that have IV values greater than 0. The IV Forecast # daily total is changed but the resulting IV Forecast % daily total will be 100%.
- Weekly total values—WFM recalculates IV Forecast # and IV Forecast % values for all week days that have IV values greater than 0. The IV Forecast # daily totals are changed but the resulting IV Forecast % daily and weekly totals will be 100%.
IV Forecast % values cannot be greater than 100%. IV Forecast % daily and weekly total must be 100%.
Editing modes
WFM provides two editing modes in the Volumes grid. Single-clicking a cell puts it into quick-editing mode and double-clicking a cell puts it into deep-editing mode. You can use either method for all editing functions.
Navigating the grid
In the grid, you can move from cell to cell by using the Enter or Shift+Enter keys on the keyboard. Click a cell and press:
- the Enter key to move the focus to the cell below the one selected.
- the Shift+Enter keys to move the focus to the cell above the one selected.
If you select a cell in the Daily total row, you can use Enter to move down one cell, but you cannot use Shift+Enter to move up one cell.
Editing values in the grid
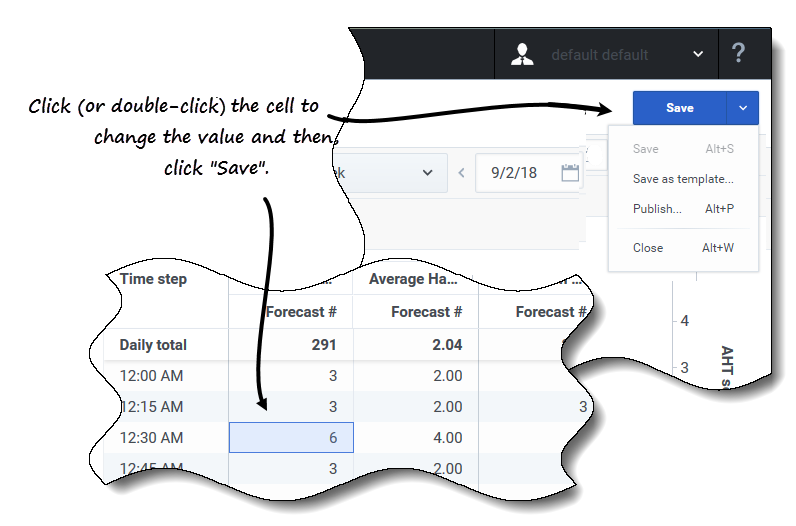
- Click (or double-click) the cell you want to change and enter a value.
- When you have finished, in the upper-right corner of the view, click Save (or use the hotkey combo Alt+S).
- A message appears in the lower-right corner, indicating your changes were saved successfully.
If you switch to another view without saving the changes, a dialog opens with the message Would you like to save changes to <scenario name>. Click:
- Save to save the changes and switch to another view.
- Discard to discard the changes and switch to another view.
- Cancel to cancel the action, close the dialog and return to the Volumes view.
In the Save menu, you can also select:
- Publish (Alt+P) if you have modified the scenario data and want republish it.
- Save as template... to save this scenario as a template.
- Close (Alt+W) to close the scenario.
Selecting data to copy and paste
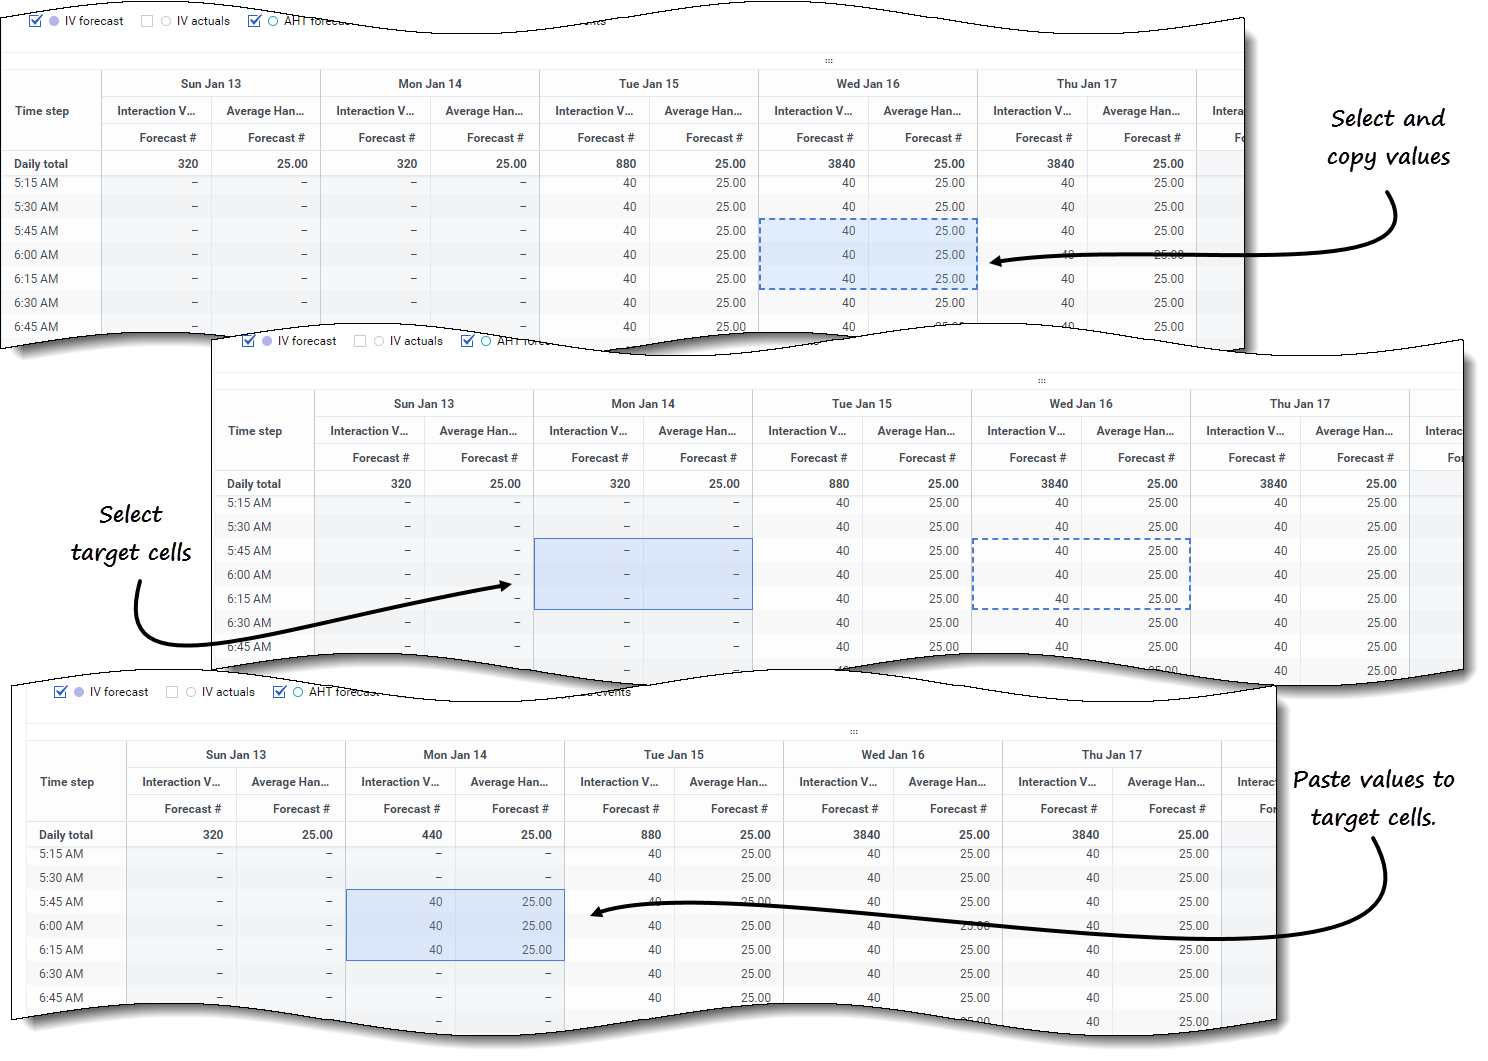
Use Copy and Paste in the toolbar or use the Ctrl-C and Ctrl-V key combinations on your keyboard to select data in the Volumes view grid for copying and pasting. You can copy/paste within the grid and to/from documents, such as Excel or Notepad. You can also copy and paste data from Master Forecasts and other scenarios.
Copy and Paste are enabled in the toolbar when you select a single cell or a range of cells. When selected, cells are highlighted and bordered with a bold solid line. When copied to the clipboard, they are bordered with a dashed or broken line. Targeted or pasted cells are highlighted and bordered with a bold solid line.When you copy empty cells together with cells that contain values, they are pasted as empty cells, overwriting any original values.
For some key combinations, you must select values in the Daily values row, Time step column, and Date column (when the selected period is Month or Year) separately. They cannot be selected with other rows or columns in the grid. Also, time step values and dates can be pasted only to external sources (not into the grid). You cannot select, copy, or paste the Timestep header row (Mon, Tue. etc.).
The grid scrolls automatically when you select a range of cells using the Arrow, Home, End, Page Up, or Page Down key, or the Shift+Arrow, Shift+Home, Shift+End, Shift+Page Up, or Shift+Page Down keys. However, if you select more cells to copy than you select for paste, only a part of data is pasted. See more information about these functions in Managing templates.
You cannot paste data if you have:
- Selected days that are outside of the scenario date range.
- Selected a business unit or site in the Objects pane. You must select an activity or multi-site activity.
- Selected values in the IV% column
Attempts to paste any of the following invalid values into the grid or Daily totals/Average row results in the message: Cannot paste invalid values.
- Letters, special symbols, or negative values
- Non integer values for IV
- AHT decimal values that have more than 2 digits after the period
- Values that are out of range
Using the Scenario Volumes toolbar
![]()
Use the following buttons on the toolbar (above the graph) to modify and manage volumes data:
| Icon | Name | Description |
|---|---|---|
| Copy | Copies data selected in the grid to the clipboard. | |
| Paste | Pastes data from the clipboard to the selected area in the grid. | |
| Build | Opens the Build Volumes wizard, enabling you to build volume data for the selected activity. | |
| Add activities | Opens the Add Activities dialog, enabling you to add activities and/or multi-site activities to existing scenarios. Find the procedure here. | |
| Remove activities | Opens the Remove Activities dialog, enabling you to remove activities and/or multi-site activities from existing scenarios. Find the procedure here. | |
| Adjust | Opens a Adjust Volumes dialog, enabling you to adjust the volume, average handling time (AHT), or both for the Scenario Forecast Volumes view. | |
| Split | Opens the Split Volumes wizard, enabling you to split interaction volumes from a multi-site activity to site-specific activities. |

