Difference between revisions of "PrivateEdition/Current/PEGuide/ConfigLog"
| Line 10: | Line 10: | ||
|structuredtext=This section explains the approaches of logging used by Genesys Multicloud CX services to write log files that contain the important diagnostic information for various issues that may arise. Support of Genesys services rely on access to these application logs. | |structuredtext=This section explains the approaches of logging used by Genesys Multicloud CX services to write log files that contain the important diagnostic information for various issues that may arise. Support of Genesys services rely on access to these application logs. | ||
| − | === | + | For more details, refer to {{Link-SomewhereInThisVersion|manual=Operations|topic=Logging_approaches|anchor=OpenshiftClusterLogging|display text=Solution-level logging approaches}}. |
| − | |||
| − | + | ===Logging architecture=== | |
| − | |||
| − | |||
This section explains the logging architecture of Genesys Multicloud CX private edition in detail. | This section explains the logging architecture of Genesys Multicloud CX private edition in detail. | ||
| − | Let's explore the logging architecture, the components involved, and its functionality through the following diagram. | + | Let's explore the logging architecture, the components involved, and its functionality through the following diagram.[[File:OCP Architecture.png|link=https://all.docs.genesys.com/File:OCP_Architecture.png]] |
| − | + | ====Logging architecture components==== | |
| − | [[File:OCP Architecture.png|link=https://all.docs.genesys.com/File:OCP_Architecture.png]] | ||
| − | |||
| − | |||
| + | ===== '''Elasticsearch cluster''' ===== | ||
Elasticsearch cluster deployed on multiple node aggregates the structured logs from Fluentd and indexes them. This includes the logs from services that follow Secondary and Complementary logging methods. You can use a log visualizer tool like Kibana to view, search, or filter the indexed logs from Elasticsearch. | Elasticsearch cluster deployed on multiple node aggregates the structured logs from Fluentd and indexes them. This includes the logs from services that follow Secondary and Complementary logging methods. You can use a log visualizer tool like Kibana to view, search, or filter the indexed logs from Elasticsearch. | ||
| − | '''Fluentd / Fluent-bit''' | + | ===== '''Fluentd / Fluent-bit''' ===== |
| − | + | Fluentd is a log collector commonly used with container platforms. It collects logs from the cluster and forwards them to Elasticsearch or an externally accessible storage such as Rsyslog server or both depending on your configuration. Fluentd /Fluent-bit collects the application logs of Genesys Multicloud CX services from '''/var/log/containers'''. While deploying cluster wide logging each node Fluentd /Fluent-bit will be deployed to each node. | |
| − | |||
| − | |||
| − | |||
| + | ===== '''Shared RWX storage''' ===== | ||
The unstructured logs are directly written in the RWX shared storage. For services writing unstructured logs, you must mount PVC/PV. To access logs externally, use a server like NFS or S3. | The unstructured logs are directly written in the RWX shared storage. For services writing unstructured logs, you must mount PVC/PV. To access logs externally, use a server like NFS or S3. | ||
| − | ===='''Syslog server storage'''==== | + | ====='''Syslog server storage'''===== |
Optionally, you can implement a syslog server to store the structured logs other than the Elasticsearch log store. Syslog server writes the logs in a flat file and enables you to share them externally. Genesys recommends Rsyslog server for this purpose, however you can select any syslog server of your choice. For more information, refer the deployment procedure. | Optionally, you can implement a syslog server to store the structured logs other than the Elasticsearch log store. Syslog server writes the logs in a flat file and enables you to share them externally. Genesys recommends Rsyslog server for this purpose, however you can select any syslog server of your choice. For more information, refer the deployment procedure. | ||
| − | |||
| − | |||
| − | |||
| − | |||
| − | |||
|Status=No | |Status=No | ||
}} | }} | ||
}} | }} | ||
Latest revision as of 03:01, March 31, 2023
Provides an overview of logging architecture in Genesys Multicloud CX private edition, different types of logging mechanisms, and related configurations.
Logging approaches and configuration
This section explains the approaches of logging used by Genesys Multicloud CX services to write log files that contain the important diagnostic information for various issues that may arise. Support of Genesys services rely on access to these application logs.
For more details, refer to Solution-level logging approaches.
Logging architecture
This section explains the logging architecture of Genesys Multicloud CX private edition in detail.
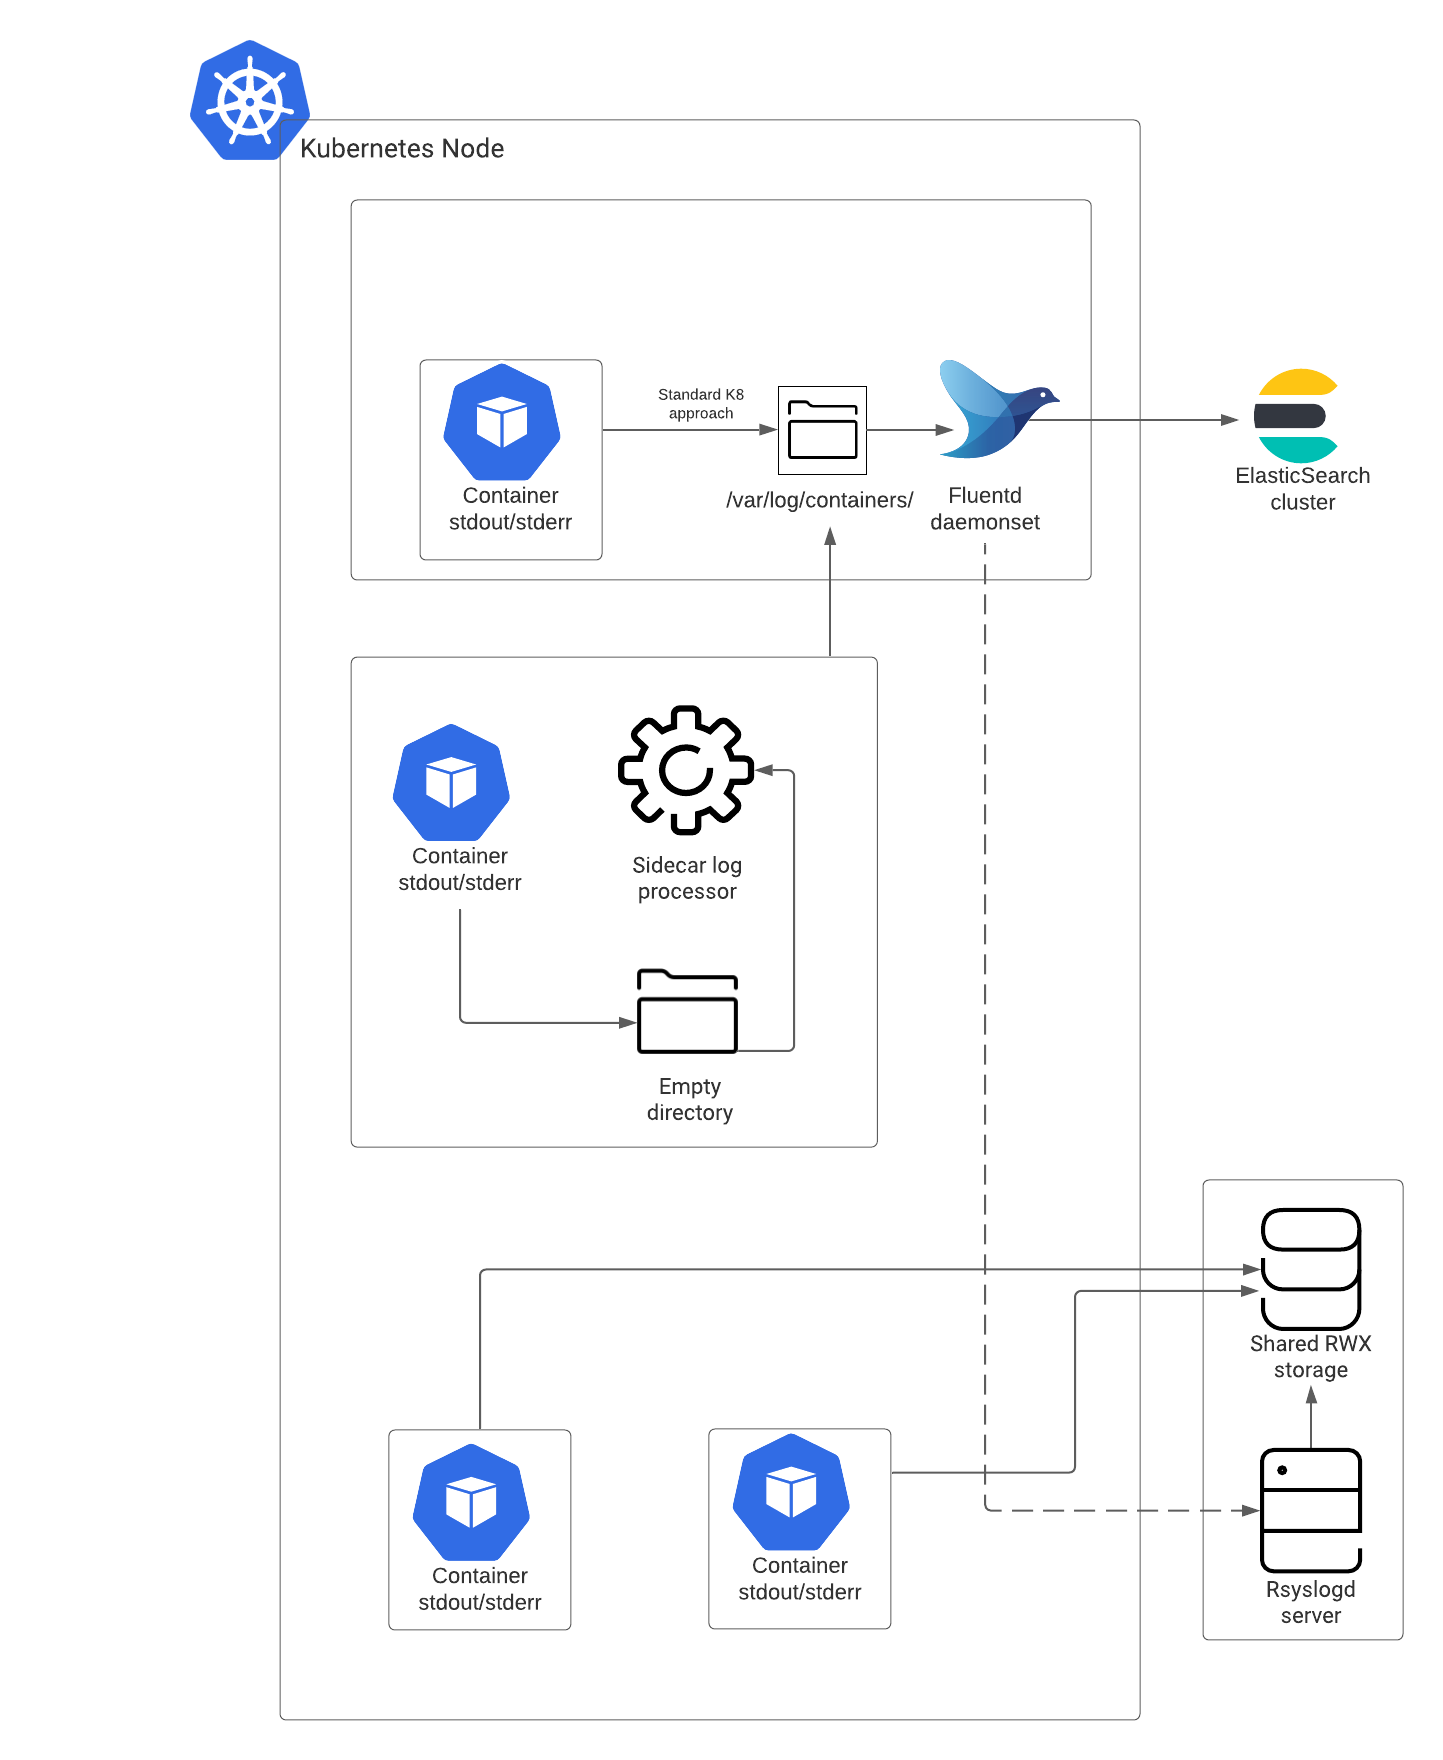
Let's explore the logging architecture, the components involved, and its functionality through the following diagram.
Logging architecture components
Elasticsearch cluster
Elasticsearch cluster deployed on multiple node aggregates the structured logs from Fluentd and indexes them. This includes the logs from services that follow Secondary and Complementary logging methods. You can use a log visualizer tool like Kibana to view, search, or filter the indexed logs from Elasticsearch.
Fluentd / Fluent-bit
Fluentd is a log collector commonly used with container platforms. It collects logs from the cluster and forwards them to Elasticsearch or an externally accessible storage such as Rsyslog server or both depending on your configuration. Fluentd /Fluent-bit collects the application logs of Genesys Multicloud CX services from /var/log/containers. While deploying cluster wide logging each node Fluentd /Fluent-bit will be deployed to each node.
Shared RWX storage
The unstructured logs are directly written in the RWX shared storage. For services writing unstructured logs, you must mount PVC/PV. To access logs externally, use a server like NFS or S3.
Syslog server storage
Optionally, you can implement a syslog server to store the structured logs other than the Elasticsearch log store. Syslog server writes the logs in a flat file and enables you to share them externally. Genesys recommends Rsyslog server for this purpose, however you can select any syslog server of your choice. For more information, refer the deployment procedure.
