
Logging overview and approaches
Contents
Learn about the structured, unstructured, and Sidecar logging methods that Genesys Multicloud CX private edition services use.
Overview and approaches
Application log files contain the important diagnostic information for various issues that may arise. Support of Genesys services rely on access to these application logs. In Genesys Multicloud CX private edition, the Genesys Multicloud CX services write these log files using different methods and formats. Some services write to a standard out/standard error (stdout/stderr) console while others write directly into an RWX shared storage. This data must be accessible outside of the cluster environment for shipping diagnostic logs for further review.
By default, GKE clusters are natively integrated with Cloud Logging. When you create a GKE cluster, Cloud Logging is enabled by default.
Solution-level logging approaches
Private edition services use one of the following approaches:
- Kubernetes-supported structured logging — The services write structured logs. These logs are written in the standard stdout/stderr console and supported by Kubernetes. Fluentd collects these logs from multiple nodes and formats them by appending Kubernetes pod and project metadata. For more information, see Kubernetes-supported structured logging.
- Sidecar processed logging — The services write their logs in a log file. A sidecar container processes these log files and then writes them to the stdout/stderr console. A log aggregator such as Fluentd collects these logs from stdout/stderr and formats them by appending Kubernetes pod and project metadata. For more information, see Sidecar processed logging.
- RWX logging (unstructured) — The services write unstructured logs. These unstructured logs can neither be directly processed by a sidecar container nor be collected by Fluentd. These services write their logs in a mounted Persistent Volume Claim (PVC) bound to Persistent Volume (PV) which is backed by an RWX shared storage such as NFS or NAS for ease of access. For more information, see RWX (unstructured) logging.
- ImportantA Cluster Administrator must create appropriate PVCs and RWX shared storage path for the services that use the RWX logging method. For more information about creating the log-specific storage, refer to the related Genesys Multicloud CX private edition services.
RWX logging is deprecated. It will be phased out with the use of sidecars to facilitate legacy logging behavior.
AKS logging approach
In Azure, the Log Analytics workspace feature in the Azure Monitor service collects log data from multiple services and system. You can create a single or multiple workspaces and feed the application logs into them.
For more detailed instructions, refer Genesys logging github.
GKE logging
Google Cloud's operations suite is backed by Google Stackdriver which controls logging, monitoring, and alerting within Google Cloud Platform. System and user workload logs are captured using Google’s own Fluentd DaemonSet called Google-Fluentd that runs on each node in your cluster. The Daemon set parses container logs and pipes them to the stackdriver for processing.
Stackdriver provides built-in log metric capabilities that allows you to monitor specific log events for building dashboards and alert policies.
By default, GKE clusters are natively integrated with cloud logging. When you create a GKE cluster, cloud logging is enabled by default.
You can create a cluster with Logging enabled, or enable Logging in an existing cluster.

Enable cloud logging
The following table provides the supported values for the --logging flag for the create and update commands.
| Source | Value | Logs collected |
|---|---|---|
| System | SYSTEM | Collects logs from:
|
| Workload | WORKLOAD | All logs generated by non-system containers running on user nodes. |
Console UI
To enable cloud logging through console UI, follow these steps:
- Navigate to Console UI using: https://console.cloud.google.com/kubernetes/list/overview?project=gcpe0001
- Select Clusters and then select the cluster name.
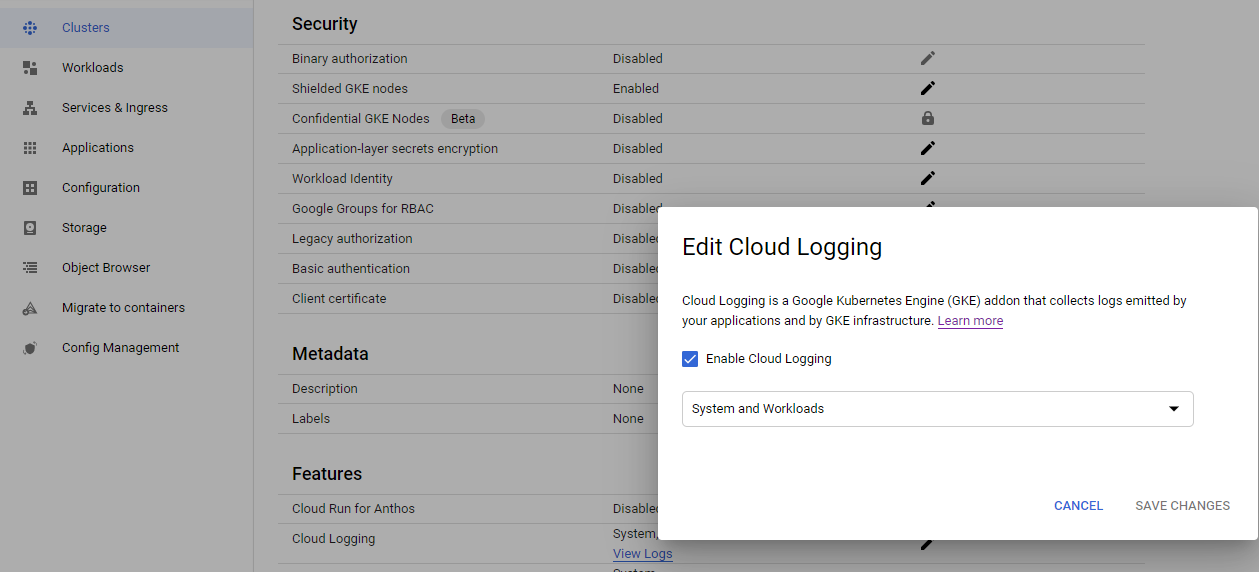
- Under Features, select Cloud Logging, and then click Edit.
- Select Enable Cloud Logging and then select System and Workflow from drop-down.
- Save the changes.
 GCloud CLI

To enable cloud logging through GCloud CLI, follow these steps:
- Log on to the existing GCloud cluster.
gcloud container clusters get-credentials gke1 --zone us-west1-a --project gcpe0001
- Configure the logs to be sent to Cloud Logging by updating a comma-separated list of values to the
gcloud container clusters updatewith--loggingflag.gcloud container clusters update gke1 \ --zone=us-west1-a \ --logging=SYSTEM,WORKLOAD
Accessing logs
Log Explorer
Log explorer is Google's central Logging UI. You can access logs for your Google cloud resources from this console, including GKE, Cloud SQL, VM instances and so on. You can then use logging filters to select the Kubernetes resources, such as cluster, node, namespace, pod, or container logs.
For more details about the console, click here.


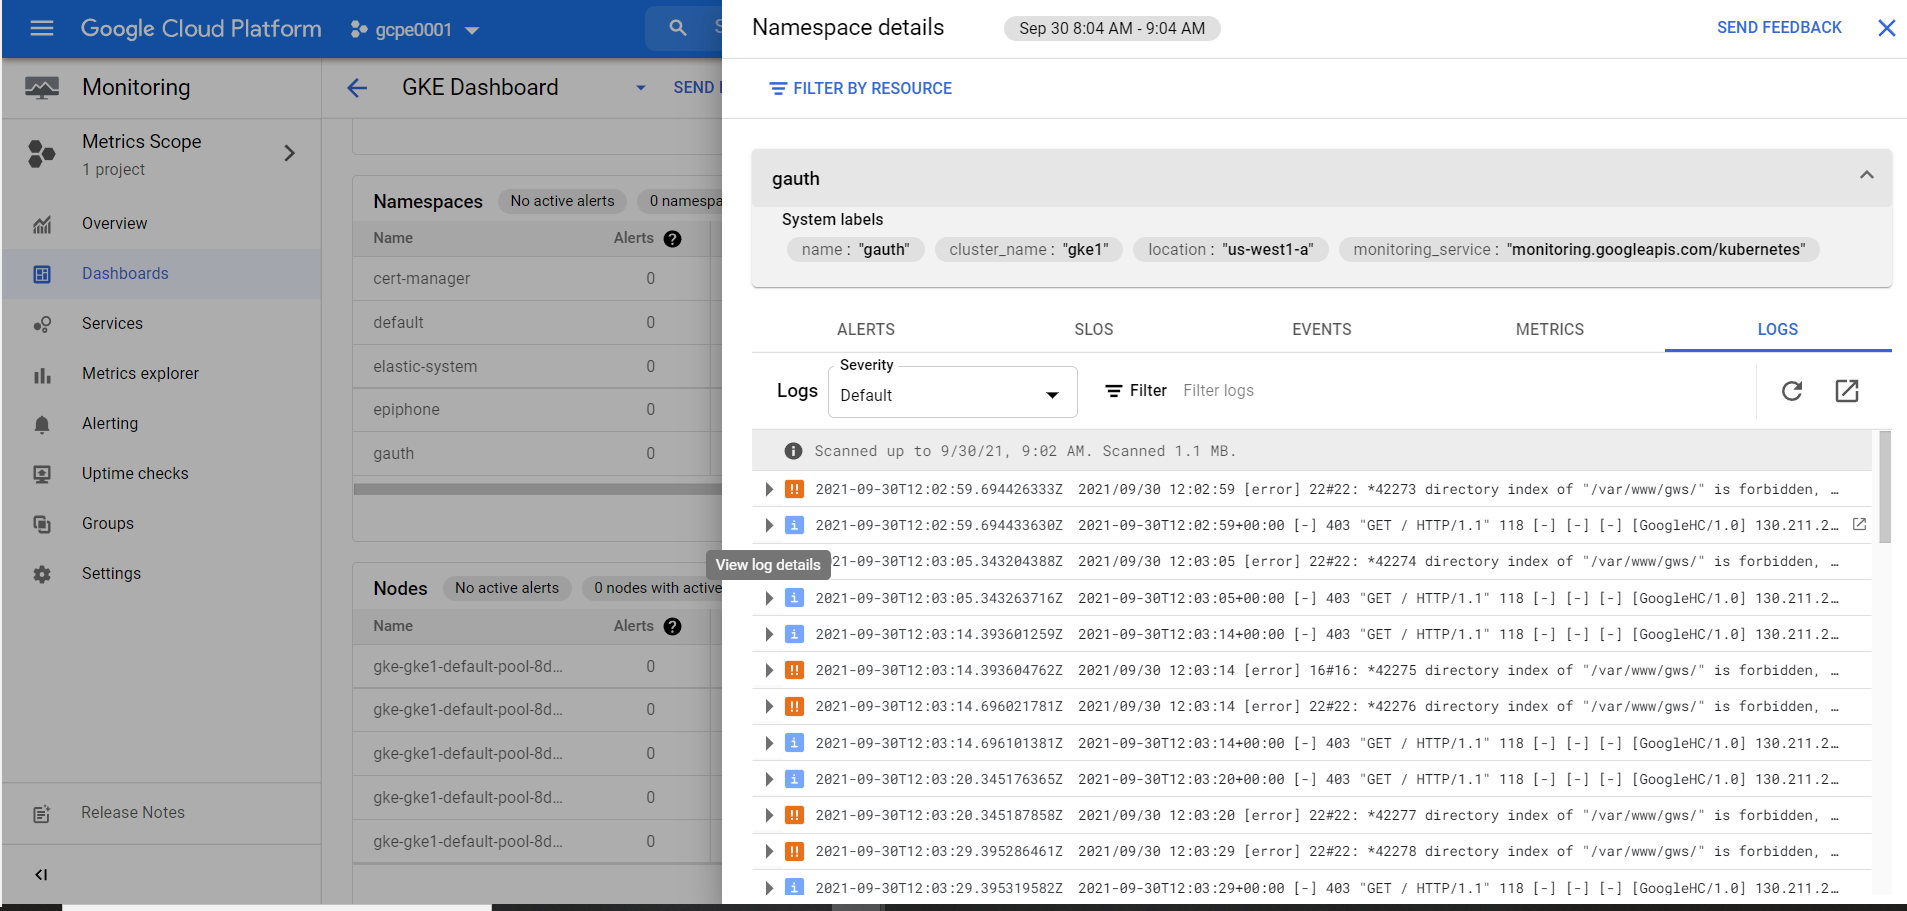
Cloud Monitoring Console
Cloud Monitoring Console allows you to track metrics of resources within your GCP/GKE environment. This console allows you to access your logs from a particular Cluster, Namespace, Node, and Pod.

 GKE Console

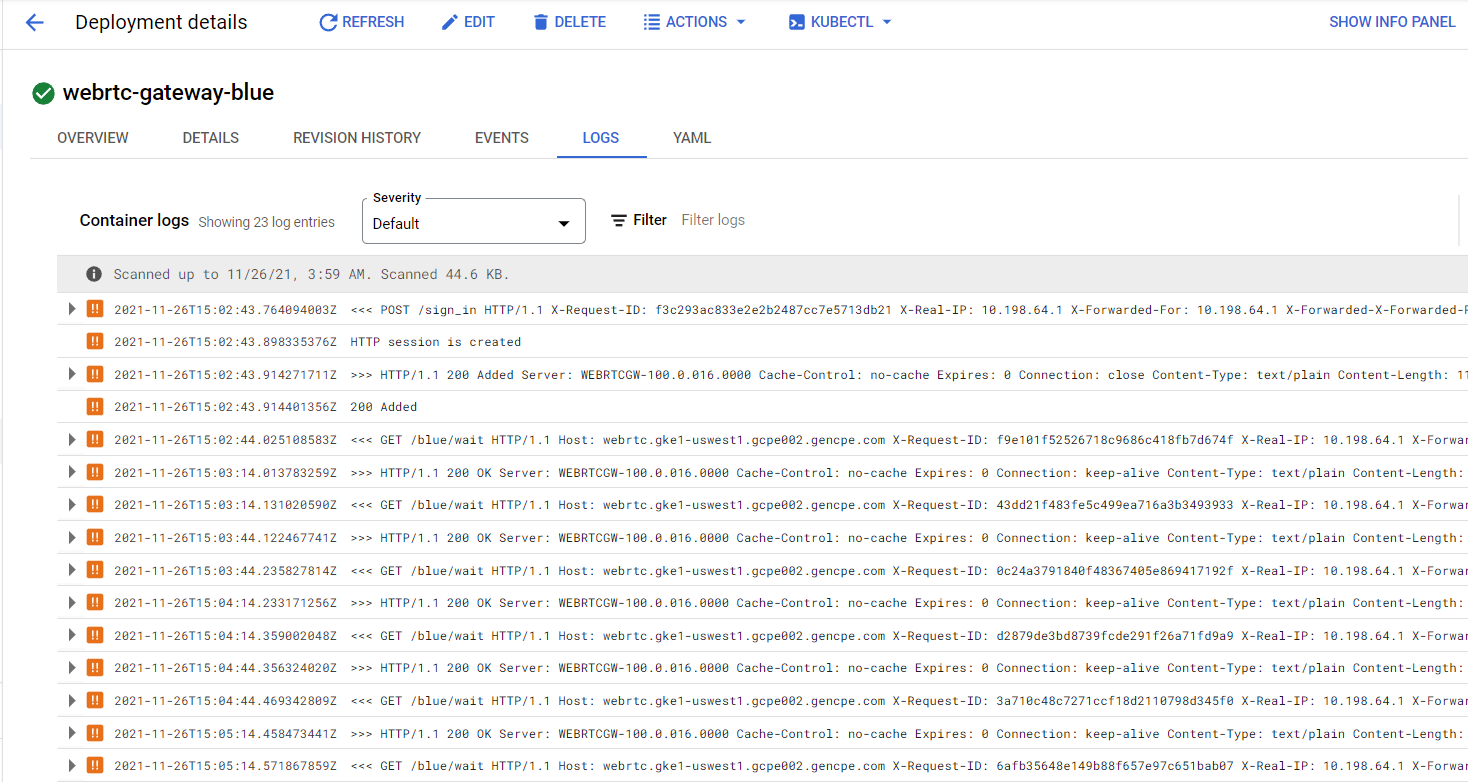
GKE web console enables you to access to logs on individual pods actively running within a workload.
There is a filter option available to filter specific events, and a drop-down field to target specific severity of log events.
Logs provide a link to access Logs Explorer from a given pod to access the main logs explorer page for enhanced querying capabilities and other features.
 Command-Line

The standard kubectl logs commands are supported in GKE. They provide actively running stdout logs from containers.
Example:kubebctl logs gvp-mcp-0 -n gvp -c fluentbit | more.png)