View table: AppSection
Table structure:
- appSectionHeading - Text
- appSectionImage - File
- appSectionGif - String
- appSectionVideo - String
- appSectionText - Wikitext
- appSectionTextwide - Wikitext
- appSectionAlignment - String
- appSectionAnchor - String
This table has 42 rows altogether.
| Page | appSectionHeading | appSectionImage | appSectionGif | appSectionVideo | appSectionText | appSectionTextwide | appSectionAlignment | appSectionAnchor | |||||||||||||||||||||||||||||||||||||||||||||||||||||||||||||||||||||
|---|---|---|---|---|---|---|---|---|---|---|---|---|---|---|---|---|---|---|---|---|---|---|---|---|---|---|---|---|---|---|---|---|---|---|---|---|---|---|---|---|---|---|---|---|---|---|---|---|---|---|---|---|---|---|---|---|---|---|---|---|---|---|---|---|---|---|---|---|---|---|---|---|---|---|---|---|---|
| DES/Current/Designer/GetStarted | More about Designer | No | 652496505 | This video highlights several of the new features and capabilities that were added to Designer during this past year (2021). It also shares a few customer success stories and offers a quick preview of what's ahead for Designer. Important The information provided in this video is for general informational purposes only. Some features or functionality described may not apply to your deployment or may have changed since the date of original production. If you have any questions, contact your Genesys representative. |
Horizontal | moreinfo | |||||||||||||||||||||||||||||||||||||||||||||||||||||||||||||||||||||||
| DES/Current/Designer/GetStarted | Next steps | No | Use this page as a starting point to learn more about key Designer features and concepts: | Vertical | next | ||||||||||||||||||||||||||||||||||||||||||||||||||||||||||||||||||||||||
| Draft:DES/Current/Designer/GetStarted | More about Designer | No | 652496505 | This video highlights several of the new features and capabilities that were added to Designer during this past year (2021). It also shares a few customer success stories and offers a quick preview of what's ahead for Designer. Important The information provided in this video is for general informational purposes only. Some features or functionality described may not apply to your deployment or may have changed since the date of original production. If you have any questions, contact your Genesys representative. |
Horizontal | moreinfo | |||||||||||||||||||||||||||||||||||||||||||||||||||||||||||||||||||||||
| Draft:DES/Current/Designer/GetStarted | Next steps | No | Use this page as a starting point to learn more about key Designer features and concepts: | Vertical | next | ||||||||||||||||||||||||||||||||||||||||||||||||||||||||||||||||||||||||
| Draft:PEC-Developer/Current/Developers/GetStarted | No | Horizontal | |||||||||||||||||||||||||||||||||||||||||||||||||||||||||||||||||||||||||||
| Draft:PEC-ES/Current/Administrator/GetStarted | What next? | No |
|
Vertical | |||||||||||||||||||||||||||||||||||||||||||||||||||||||||||||||||||||||||
| Draft:PEC-REC/Current/Administrator/GetStarted | Multilingual support | No | SpeechMiner web application supports multiple languages. When you log into SpeechMiner, the web UI is displayed in a language that you selected in the browser. If you select an unsupported language in the browser, the SpeechMiner Web UI defaults to en-US.SpeechMiner language supportSpeechMiner language recognition and user interface (UI) support is available for the following languages:
|
Vertical | |||||||||||||||||||||||||||||||||||||||||||||||||||||||||||||||||||||||||
| Draft:PEC-REP/Current/GCXIMCPRG/HRCXIAboutProjects | Video: Learn about this guide | No | 716424846 | Watch this video to learn how to use the Projects Reference Guide. | Horizontal | VideoGetStarted | |||||||||||||||||||||||||||||||||||||||||||||||||||||||||||||||||||||||
| Draft:PEC-REP/Current/GVP/GetStarted | GVP Report display controls | No | The controls listed below are for data table panels that appear to the right of the filter column. You don't need to know all of them, just the commands that will show you the most useful data. The controls listed below are for data table panels that appear to the right of the filter column. You don't need to know all of them, just the commands that will show you the most useful data.
|
Vertical | displaycontrols | ||||||||||||||||||||||||||||||||||||||||||||||||||||||||||||||||||||||||
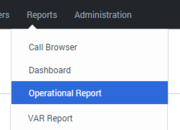
| Draft:PEC-REP/Current/GVP/GetStarted | How to choose a GVP report | No |
When you first open a report, it contains no data. Use the filters dialog box on the left side of your browser window to decide what information to include. Then, generate the report. |
Each report offers multiple report types, with different characteristics such as multiple data sets and access to the data for multiple Genesys components. You can design a filter to display only the data that you want to see. That kind of control is huge when it's time to read a report! You've selected a report type and displayed an empty table. Now you can fill it with the data that you need. |
Horizontal | choose | |||||||||||||||||||||||||||||||||||||||||||||||||||||||||||||||||||||||
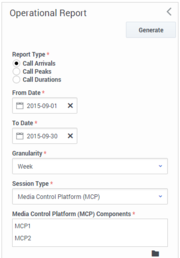
| Draft:PEC-REP/Current/GVP/GetStarted | How to design a GVP report | No | GVP Reports can access a huge pool of data about calls. Use the report filter to find and focus on the specific data that will help you make informed decisions. For example, the filter on the left will let you compare how well two different MCPs handled Call Arrivals for the month of September, broken down by the week. Mine the data easily with filtersUse the filters to design a report's output. These are your tools for mining the database. Click each link below to learn about the many ways that you can focus your chosen report type on the exact data that you seek: Note: Some report types may not be part of your installation. |
The Report filter control panel is on the left side of the page. Look for these generic control buttons in the filters panel:
|
Horizontal | design | |||||||||||||||||||||||||||||||||||||||||||||||||||||||||||||||||||||||
| Draft:PEC-REP/Current/GVP/GetStarted | How to generate a GVP report | No | Click Generate at the top (or the bottom) of any report filter dialog. | Horizontal | generate | ||||||||||||||||||||||||||||||||||||||||||||||||||||||||||||||||||||||||
| Draft:PEC-REP/Current/GVP/GetStarted | How to read a GVP report | No | A report can contain many layers of useful data that stays out of your way—until you dig deeper for it. The report appears in a table that occupies the right-hand 3/4 of your browser window. You clicked Generate to populate the table with the data types you selected in the filter dialog. Now click a row to underline (select) it, then double-click to "drill down"—see more detail about that row in a new table to the right (and usually off the screen). You can continue to drill down, and generate new details in new tables, as long as you can select a line. |
Click the Export button to save all generated (in other words, currently viewable) data to a file—including data that is off the screen but you could scroll to see. | Horizontal | read | |||||||||||||||||||||||||||||||||||||||||||||||||||||||||||||||||||||||
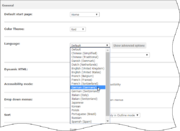
| Draft:PEC-REP/Current/RPRT/GetStarted | Changing the language used in the reports | No | 439922447 | Before you can select a language, an administrator must enable it on the server. Talk to your administrator to find out what language is available for your use. Changes described in this procedure apply only to your own sessions, not to other users. Note that the language used in some parts of reports cannot be changed. For example, some prompt values are presented in English, even after localization is applied. Use the following steps to change the language used in the GUI and reports.
|
Supported languagesGenesys CX Insights provides support to translate (localize) the GUI and Genesys CX Insights reports into the languages listed in the following tables. The available list of languages varies depending on the project you are working in (for example, the Genesys CX Insights project or the Genesys CX Insights for iWD project):
|
Horizontal | ChangeLang | ||||||||||||||||||||||||||||||||||||||||||||||||||||||||||||||||||||||
| Draft:PEC-REP/Current/RPRT/GetStarted | Learn more about Genesys CX Insights | No | In this document, you can find information about the following topics:
To view more detailed information about the metrics and attributes used in the reports, and about other metrics and attributes that you can use to customize reports, see the Genesys CX Insights Multicloud Projects Reference Guide. |
Vertical | MoreInfo | ||||||||||||||||||||||||||||||||||||||||||||||||||||||||||||||||||||||||
| Draft:PEC-REP/Current/RT/Accessibility | Video: Navigate Pulse using the keyboard | No | 723751305 | Watch this video to learn how to navigate Pulse using the keyboard. | Horizontal | VideoGetStarted | |||||||||||||||||||||||||||||||||||||||||||||||||||||||||||||||||||||||
| Draft:PEC-REP/Current/RT/GetStarted | Access Reports | No | To see the real-time reports, open the Genesys Pulse dashboard. Reports are displayed in widgets, which you can expand to dashboard size to view more detail. |
Horizontal | |||||||||||||||||||||||||||||||||||||||||||||||||||||||||||||||||||||||||
| Draft:PEC-REP/Current/RT/GetStarted | Drill-down for more detail | No | Genesys Pulse enables you to drill-down from values that represent a collection of items, to learn more about individual items, for example, where Pulse displays metrics about an agent group, you can drill down to the individual agents within the group. Drill-down must be enabled for a widget for this feature to be available, and the widget must use a template that supports drill-down. Where applicable, Pulse supports drill-down for the following object types:
|
Vertical | |||||||||||||||||||||||||||||||||||||||||||||||||||||||||||||||||||||||||
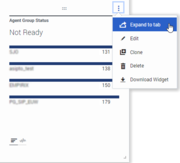
| Draft:PEC-REP/Current/RT/GetStarted | Expand Reports to Dashboard | No | To see a detailed view of your report, click More in the upper right corner of a widget and select Expand to Tab. This expanded report opens within a new tab, so it doesn't impact your initial dashboard. You can:
|
Horizontal | |||||||||||||||||||||||||||||||||||||||||||||||||||||||||||||||||||||||||
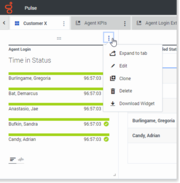
| Draft:PEC-REP/Current/RT/GetStarted | Manage Dashboards and Wallboards | No | Use tabs to manage Genesys Pulse dashboards and wallboards. For more options, click the More kebab menu (the three vertical dots menu) in the upper right corner of the dashboard:
|
Horizontal | |||||||||||||||||||||||||||||||||||||||||||||||||||||||||||||||||||||||||
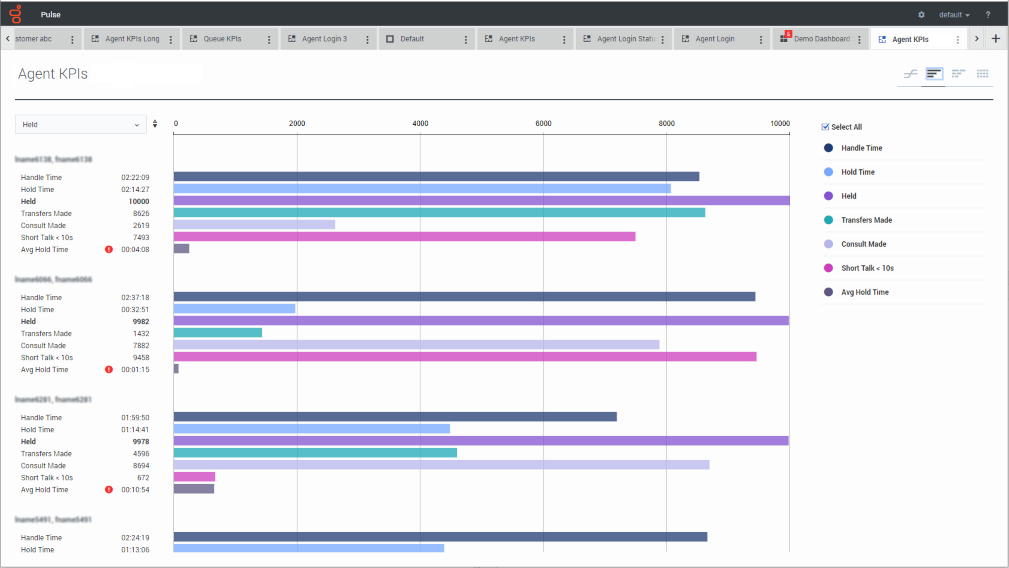
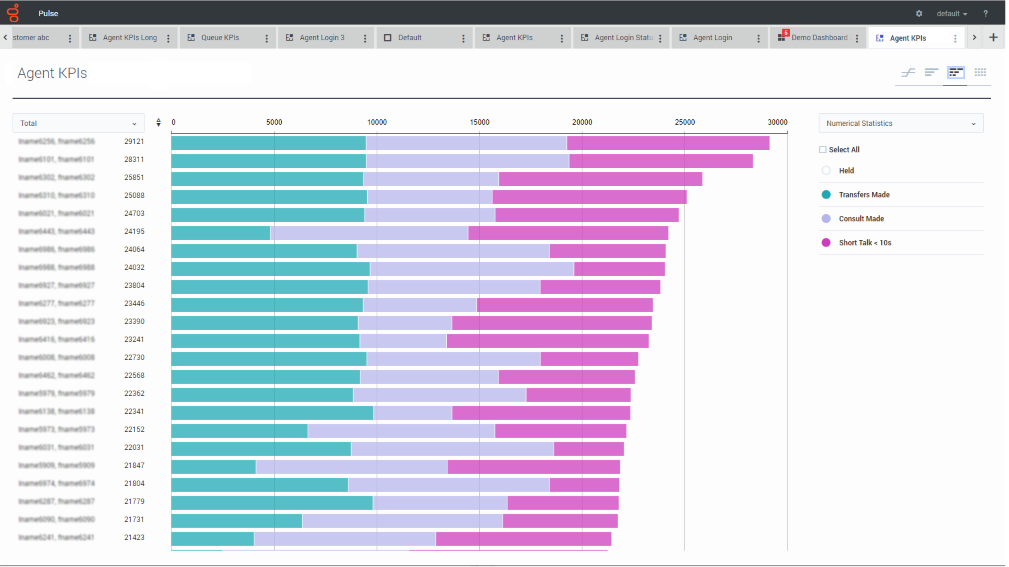
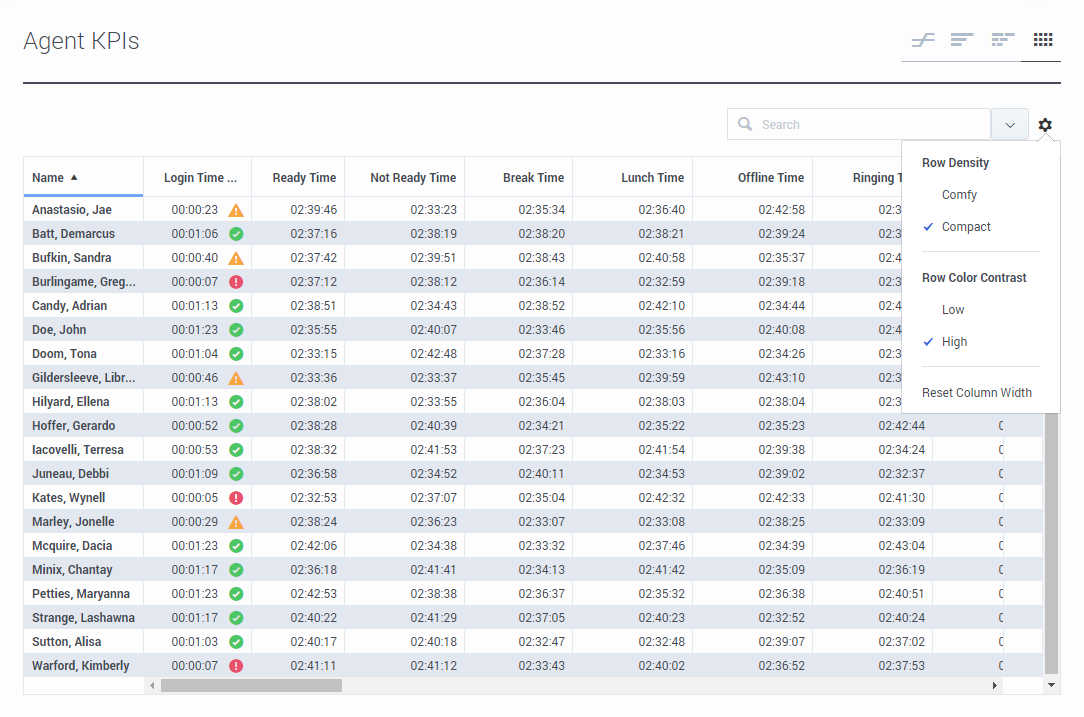
| Draft:PEC-REP/Current/RT/GetStarted | Use Report Widgets | No | Genesys Pulse widgets display Donut, Data, Key Performance Indicator (KPI), Time Tracking, or List charts of key statistics for objects on your dashboard. You can:
You can also add new widgets to your dashboard. |
Horizontal | |||||||||||||||||||||||||||||||||||||||||||||||||||||||||||||||||||||||||
| Draft:PEC-REP/Current/RT/GetStarted | Video: Get started with Pulse | No | 719137971 | Watch this video to learn how to access and use Genesys Pulse. | Horizontal | VideoGetStarted | |||||||||||||||||||||||||||||||||||||||||||||||||||||||||||||||||||||||
| Draft:PEC-REP/Current/RT/GetStarted | What do I do next? | No | Learn more about related topics: | Vertical | |||||||||||||||||||||||||||||||||||||||||||||||||||||||||||||||||||||||||
| Draft:PEC-REP/Current/RT/RTRTemplates | Video: Create and manage report templates | No | 736546552 | Watch this video to learn how to manage report templates. | Horizontal | VideoGetStarted | |||||||||||||||||||||||||||||||||||||||||||||||||||||||||||||||||||||||
| PEC-ES/Current/Administrator/GetStarted | What next? | No |
|
Vertical | |||||||||||||||||||||||||||||||||||||||||||||||||||||||||||||||||||||||||
| PEC-REC/Current/Administrator/GetStarted | Multilingual support | No | SpeechMiner web application supports multiple languages. When you log into SpeechMiner, the web UI is displayed in a language that you selected in the browser. If you select an unsupported language in the browser, the SpeechMiner Web UI defaults to en-US.SpeechMiner language supportSpeechMiner language recognition and user interface (UI) support is available for the following languages:
|
Vertical | |||||||||||||||||||||||||||||||||||||||||||||||||||||||||||||||||||||||||
| PEC-REP/Current/GCXIMCPRG/HRCXIAboutProjects | Video: Learn about this guide | No | 716424846 | Watch this video to learn how to use the Projects Reference Guide. | Horizontal | VideoGetStarted | |||||||||||||||||||||||||||||||||||||||||||||||||||||||||||||||||||||||
| PEC-REP/Current/GVP/GetStarted | GVP Report display controls | No | The controls listed below are for data table panels that appear to the right of the filter column. You don't need to know all of them, just the commands that will show you the most useful data. The controls listed below are for data table panels that appear to the right of the filter column. You don't need to know all of them, just the commands that will show you the most useful data.
|
Vertical | displaycontrols | ||||||||||||||||||||||||||||||||||||||||||||||||||||||||||||||||||||||||
| PEC-REP/Current/GVP/GetStarted | How to choose a GVP report | No |
When you first open a report, it contains no data. Use the filters dialog box on the left side of your browser window to decide what information to include. Then, generate the report. |
Each report offers multiple report types, with different characteristics such as multiple data sets and access to the data for multiple Genesys components. You can design a filter to display only the data that you want to see. That kind of control is huge when it's time to read a report! You've selected a report type and displayed an empty table. Now you can fill it with the data that you need. |
Horizontal | choose | |||||||||||||||||||||||||||||||||||||||||||||||||||||||||||||||||||||||
| PEC-REP/Current/GVP/GetStarted | How to design a GVP report | No | GVP Reports can access a huge pool of data about calls. Use the report filter to find and focus on the specific data that will help you make informed decisions. For example, the filter on the left will let you compare how well two different MCPs handled Call Arrivals for the month of September, broken down by the week. Mine the data easily with filtersUse the filters to design a report's output. These are your tools for mining the database. Click each link below to learn about the many ways that you can focus your chosen report type on the exact data that you seek: Note: Some report types may not be part of your installation. |
The Report filter control panel is on the left side of the page. Look for these generic control buttons in the filters panel:
|
Horizontal | design | |||||||||||||||||||||||||||||||||||||||||||||||||||||||||||||||||||||||
| PEC-REP/Current/GVP/GetStarted | How to generate a GVP report | No | Click Generate at the top (or the bottom) of any report filter dialog. | Horizontal | generate | ||||||||||||||||||||||||||||||||||||||||||||||||||||||||||||||||||||||||
| PEC-REP/Current/GVP/GetStarted | How to read a GVP report | No | A report can contain many layers of useful data that stays out of your way—until you dig deeper for it. The report appears in a table that occupies the right-hand 3/4 of your browser window. You clicked Generate to populate the table with the data types you selected in the filter dialog. Now click a row to underline (select) it, then double-click to "drill down"—see more detail about that row in a new table to the right (and usually off the screen). You can continue to drill down, and generate new details in new tables, as long as you can select a line. |
Click the Export button to save all generated (in other words, currently viewable) data to a file—including data that is off the screen but you could scroll to see. | Horizontal | read | |||||||||||||||||||||||||||||||||||||||||||||||||||||||||||||||||||||||
| PEC-REP/Current/RPRT/GetStarted | Changing the language used in the reports | No | 439922447 | Before you can select a language, an administrator must enable it on the server. Talk to your administrator to find out what language is available for your use. Changes described in this procedure apply only to your own sessions, not to other users. Note that the language used in some parts of reports cannot be changed. For example, some prompt values are presented in English, even after localization is applied. Use the following steps to change the language used in the GUI and reports.
|
Supported languagesGenesys CX Insights provides support to translate (localize) the GUI and Genesys CX Insights reports into the languages listed in the following tables. The available list of languages varies depending on the project you are working in (for example, the Genesys CX Insights project or the Genesys CX Insights for iWD project):
|
Horizontal | ChangeLang | ||||||||||||||||||||||||||||||||||||||||||||||||||||||||||||||||||||||
| PEC-REP/Current/RPRT/GetStarted | Learn more about Genesys CX Insights | No | In this document, you can find information about the following topics:
To view more detailed information about the metrics and attributes used in the reports, and about other metrics and attributes that you can use to customize reports, see the Genesys CX Insights Multicloud Projects Reference Guide. |
Vertical | MoreInfo | ||||||||||||||||||||||||||||||||||||||||||||||||||||||||||||||||||||||||
| PEC-REP/Current/RT/Accessibility | Video: Navigate Pulse using the keyboard | No | 723751305 | Watch this video to learn how to navigate Pulse using the keyboard. | Horizontal | VideoGetStarted | |||||||||||||||||||||||||||||||||||||||||||||||||||||||||||||||||||||||
| PEC-REP/Current/RT/GetStarted | Access Reports | No | To see the real-time reports, open the Genesys Pulse dashboard. Reports are displayed in widgets, which you can expand to dashboard size to view more detail. |
Horizontal | |||||||||||||||||||||||||||||||||||||||||||||||||||||||||||||||||||||||||
| PEC-REP/Current/RT/GetStarted | Expand Reports to Dashboard | No | To see a detailed view of your report, click More in the upper right corner of a widget and select Expand to Tab. This expanded report opens within a new tab, so it doesn't impact your initial dashboard. You can:
|
Horizontal | |||||||||||||||||||||||||||||||||||||||||||||||||||||||||||||||||||||||||
| PEC-REP/Current/RT/GetStarted | Manage Dashboards and Wallboards | No | Use tabs to manage Genesys Pulse dashboards and wallboards. For more options, click the More kebab menu (the three vertical dots menu) in the upper right corner of the dashboard:
|
Horizontal | |||||||||||||||||||||||||||||||||||||||||||||||||||||||||||||||||||||||||
| PEC-REP/Current/RT/GetStarted | Use Report Widgets | No | Genesys Pulse widgets display Donut, Data, Key Performance Indicator (KPI), Time Tracking, or List charts of key statistics for objects on your dashboard. You can:
You can also add new widgets to your dashboard. |
Horizontal | |||||||||||||||||||||||||||||||||||||||||||||||||||||||||||||||||||||||||
| PEC-REP/Current/RT/GetStarted | Video: Get started with Pulse | No | 719137971 | Watch this video to learn how to access and use Genesys Pulse. | Horizontal | VideoGetStarted | |||||||||||||||||||||||||||||||||||||||||||||||||||||||||||||||||||||||
| PEC-REP/Current/RT/GetStarted | What do I do next? | No | Learn more about related topics: | Vertical | |||||||||||||||||||||||||||||||||||||||||||||||||||||||||||||||||||||||||
| PEC-REP/Current/RT/RTRTemplates | Video: Create and manage report templates | No | 736546552 | Watch this video to learn how to manage report templates. | Horizontal | VideoGetStarted |

