Dashboard and Wallboard Examples

From Genesys Documentation
Jump to: navigation, search
This topic is part of the manual Real-time Reporting with Pulse for version Current of Reporting.

View examples of dashboards and wallboards to help you choose what you want to display.

You can use the following examples to help you decide which real-time reports to display on your dashboard or wallboard.

Dashboard examples

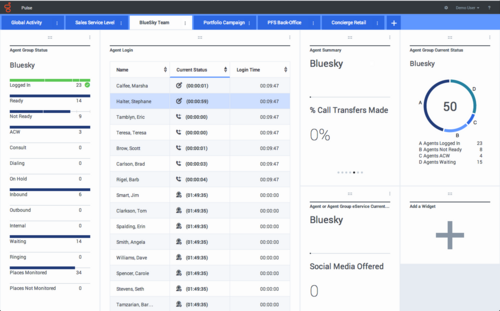
Sales team lead dashboard

The sales team lead dashboard displays helpful information such as the Agent Group Status and Agent Login details.

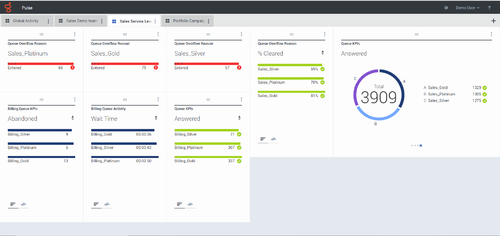
Sales service level dashboard for a supervisor

The sales service level dashboard for supervisors displays helpful information such as Queue Overflow Reasons and Queue KPIs.

Multi-channel dashboard for a supervisor

The multi-channel dashboard for supervisors displays helpful information such as Chat Sales Activity and Email Sales Activity.

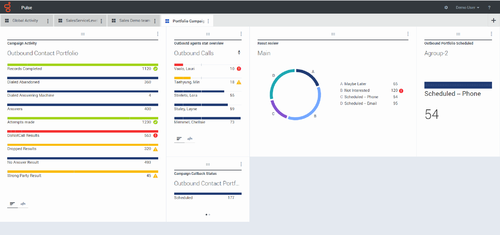
Outbound campaign dashboard for a supervisor

The Outbound campaign dashboard for supervisors displays helpful information such as Outbound Campaign activity and a results review.

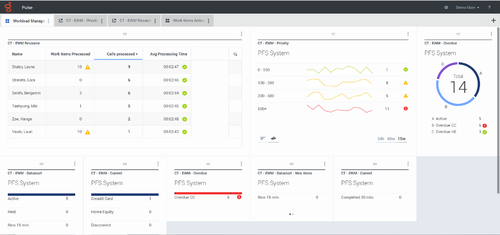
Back-office dashboard for a supervisor

The Back-office dashboard for supervisors displays helpful information such as Work Items Processed, and Average Processing Time.

Wallboard example

Sales wallboard

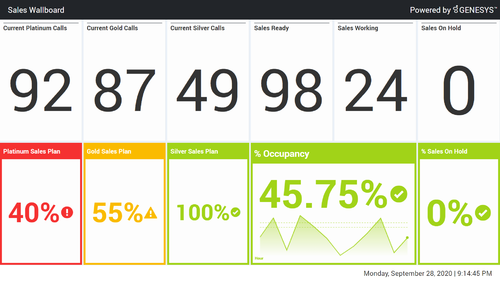
The Sales Wallboard displays color-coded fields to distinguish status and urgency for call and sales activity.
Comments or questions about this documentation? Contact us for support!