
Get Started with Genesys Pulse
Genesys Pulse is your gateway for monitoring your contact center, so you can better meet your business needs. This getting started page will get you running, viewing, and managing reports.
Contents
Access the application[edit source]

Once your Genesys Multicloud CX environment is up and running and you've checked that you meet the necessary requirements, log in to your Genesys Portal to access Pulse Reporting. Click the Pulse Reporting icon and enter your username and password.
Walk through the application
Genesys Pulse provides at-a-glance views of real-time contact center statistics on dashboards within the user interface.
Video: Get started with Pulse
Watch this video to learn how to access and use Genesys Pulse.
Access Reports

To see the real-time reports, open the Genesys Pulse dashboard.
Reports are displayed in widgets, which you can expand to dashboard size to view more detail.
Manage Dashboards and Wallboards

Use tabs to manage Genesys Pulse dashboards and wallboards. For more options, click the More kebab menu (the three vertical dots menu) in the upper right corner of the dashboard:
- Add a Widget—Add a new widget to the dashboard or wallboard.
- Clone—Create a new copy of the dashboard or wallboard.
- Close—Close the dashboard or wallboard.
- Customize—Change the name, description, and other options of the dashboard or wallboard.
- Download—Export dashboard or wallboard in JSON format.
- Launch—Open a wallboard.
- Publish—Share the unpublished dashboard or wallboard.
- Save As—Save a new copy of the published dashboard or wallboard.
- Update Shared Copy—Replace the published copy of the dashboard or wallboard.
Use Report Widgets

Genesys Pulse widgets display Donut, Data, Key Performance Indicator (KPI), Time Tracking, or List charts of key statistics for objects on your dashboard.
You can:
- Clone—Create a copy of the widget.
- Delete—Delete the widget.
- Download—Download the report data as a .csv file.
- Edit—Edit the widget.
- Expand to Tab—See an expanded, detailed view of the report.
You can also add new widgets to your dashboard.
Expand Reports to Dashboard

To see a detailed view of your report, click More in the upper right corner of a widget and select Expand to Tab. This expanded report opens within a new tab, so it doesn't impact your initial dashboard.
You can:
- Download the report data as a .csv file by selecting Download Widget from the More menu.
- Change the source widget by selecting Edit from the More menu.
- Sort options, define objects, and define statistics.
- View various chart types available in the expanded widget:
- Time Tracking
- Grouped Bar
- Stacked Bar
- Stacked Bar
- Data
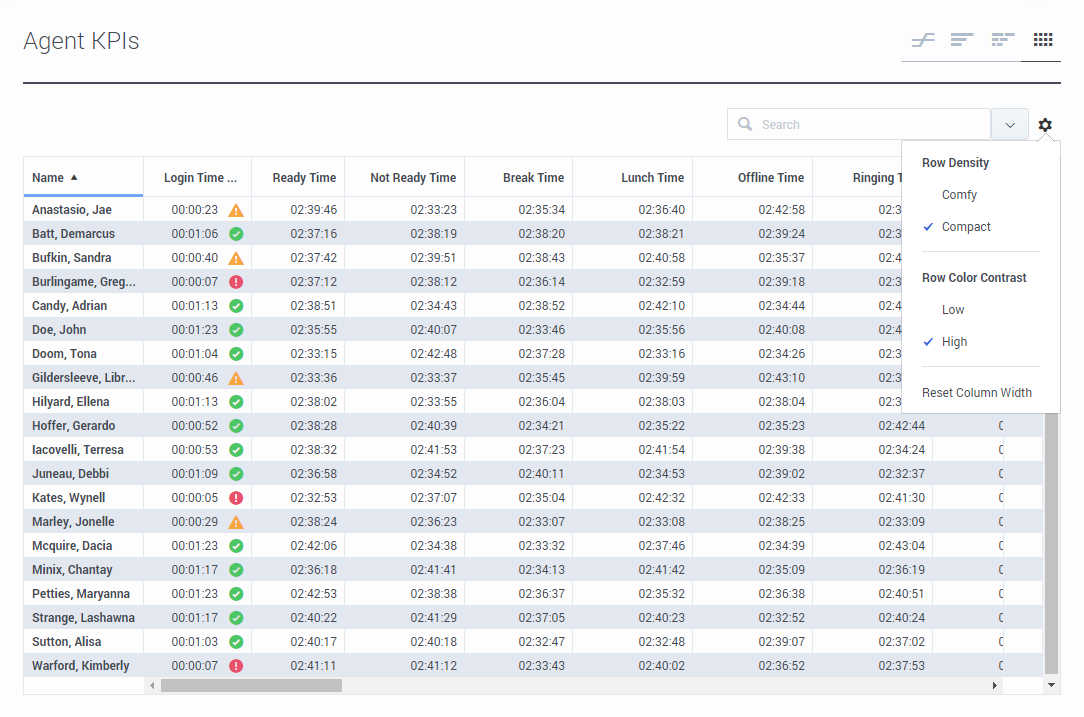
- Starting with release 9.0.001, new options are available in the Customize menu:
- Row Density:
Comfy (default) or Compact - Row Color Contrast:
Low (default) or High - Reset Column Width - resets columns width to default values.
- Row Density:
- Starting with release 9.0.001, new options are available in the Customize menu:
- Time Tracking


What do I do next?
Learn more about related topics: