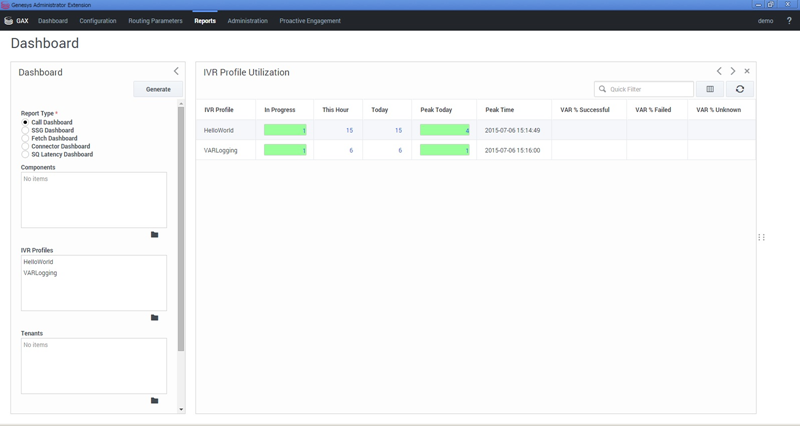
Dashboard report filters
Dashboard reports help you monitor calls (either in-progress or completed) from the perspective of IVR Profiles or GVP components.
The dashboard display offers basic information such as the number of calls and call peaks.
You can monitor IVR Profile activity for the current day and time, in a table that includes a graph of the current burst levels for each IVR Profile that you select.
As with IVR profiles, you can monitor the real-time activity of GVP components that you select, for the current day and time. Use the filter controls to focus on the data that you want to see.
For example, the filters in the screen shot will deliver a report with two separate sections: one will report on the performance of two different Resource Managers; the other will show the performance for the IVR profile media.
Also on this page:
Report filter controls
These filters let you focus on the data that is important to you right now.
| Data Display Element | Purpose / Functionality |
|---|---|
| Report Type* | Select a report type from this list of radio buttons: Call Dashboard, SSG Dashboard, Fetch Dashboard, Connector Dashboard, SQ Latency Dashboard. |
| Query Data From* | Select a site from the drop-down list, to be the source of the report's data.
Click the Browse button and select up to eight sites from the list of check boxes. |
| Application | Select an Application from the drop-down menu at the top of the Component panel to the right. Note: Enabled only if the Call Dashboard report type is selected. |
| Components | Select a Component from the panel to the right. Note: Enabled only if the Call Dashboard report type is selected. The available items depend on the Application selection above this list. |
| Supplementary Services Gateway (SSG) Gateway Components | Select a gateway from the Application (ASG) panel to the right. Note: Enabled only if the SSG Dashboard report type is selected. |
| Component Type* | Select a Component Type from the panel to the right. This row appears only in the Fetch Dashboard (where MCP and CCP are the choices) and in the Connector Dashboard (where PSTNC and CTIC are the choices). Note: Enabled only if the Fetch Dashboard or Component Dashboard report types are selected. The available items depend on the Application selection listed above. |
| IVR Profiles | Click the Browse icon (a solid black folder) beneath this field, then select or clear the check box next to each IVR profile in the list in the data field to the right. |
| Tenants | Click the Browse icon (a solid black folder) beneath this field, then selectSelect or clear the check box next to each Tenant in the list in the data field to the right. |
| Refresh (seconds) | Enter a whole number from 5 to 1800 as the interval in seconds the dashboard reports automatically refreshes. |
Sample Dashboard report


