Get started with GVP reporting
Learn how to get started with Genesys Voice Platform (GVP) reports.
Contents
Genesys Voice Platform has many moving parts—individual components that perform different tasks during a call. GVP reports give you a diagnostic look at your contact center's performance, by monitoring how the components perform—by themselves and with each other. The goal is to improve your contact center's efficiency.
With Genesys Voice Platform reports you can:
- Browse the Call Detail Records (CDRs) of in-progress and completed calls, filtering for the different components that process them. You can observe how each component is performing.
- Gather statistics on events such as call arrivals, call durations, and peak call volume— then sort or filter by IVR Profile, or by GVP component.
- Observe the success and failure rates for calls, and the IVR Actions that handle them.
Access the application[edit source]
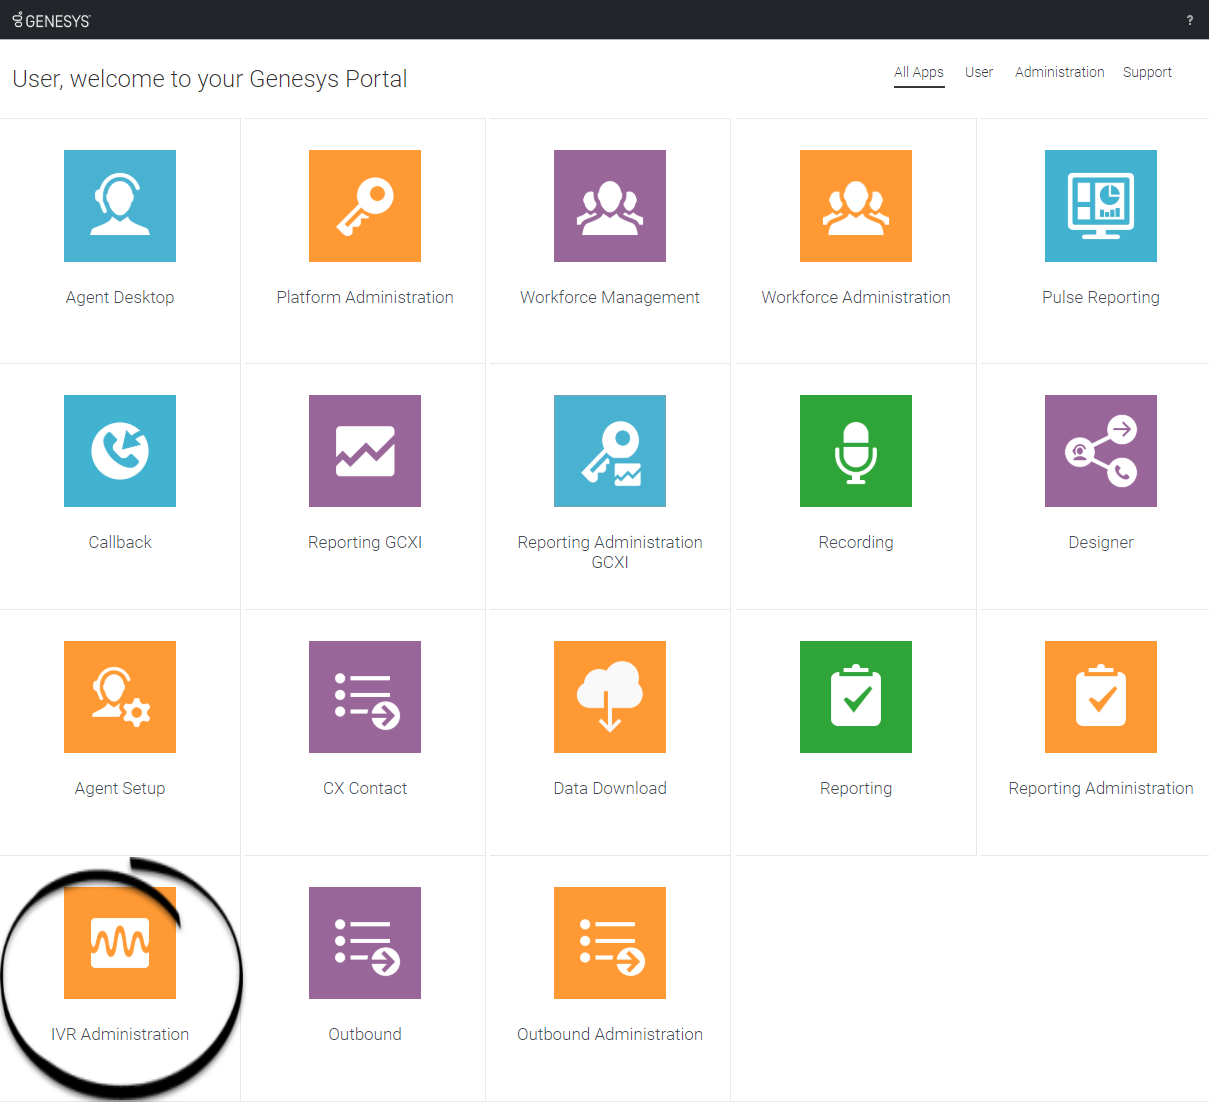
Once your Genesys Multicloud CX environment is up and running and you've checked that you meet the necessary requirements, log in to your Genesys Portal to access IVR Administration. Click the IVR Administration icon and enter your username and password.
How to choose a GVP report
- On the Genesys Portal, click the IVR Administration icon.
- If prompted, enter your user name and password.
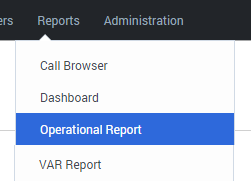
- The Configuration Manager page appears. Select a report type from the Reports drop-down menu.
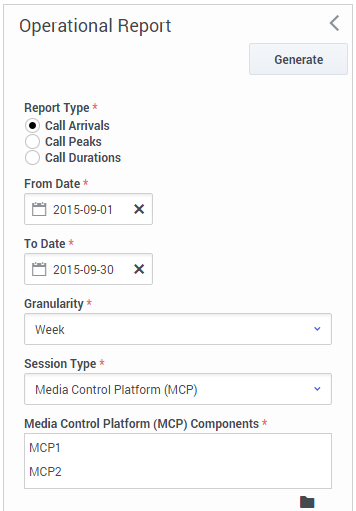
When you first open a report, it contains no data. Use the filters dialog box on the left side of your browser window to decide what information to include. Then, generate the report.
Each report offers multiple report types, with different characteristics such as multiple data sets and access to the data for multiple Genesys components. You can design a filter to display only the data that you want to see. That kind of control is huge when it's time to read a report!
You've selected a report type and displayed an empty table. Now you can fill it with the data that you need.
How to design a GVP report
GVP Reports can access a huge pool of data about calls. Use the report filter to find and focus on the specific data that will help you make informed decisions.
For example, the filter on the left will let you compare how well two different MCPs handled Call Arrivals for the month of September, broken down by the week.
Mine the data easily with filters
Use the filters to design a report's output. These are your tools for mining the database. Click each link below to learn about the many ways that you can focus your chosen report type on the exact data that you seek:
Note: Some report types may not be part of your installation.
The Report filter control panel is on the left side of the page.
Look for these generic control buttons in the filters panel:
 Collapse or
  Restore the report filters panel.
 Browse a list for filter items that you can select, or
  Clear the current value.
How to generate a GVP report
How to read a GVP report
A report can contain many layers of useful data that stays out of your way—until you dig deeper for it. The report appears in a table that occupies the right-hand 3/4 of your browser window.
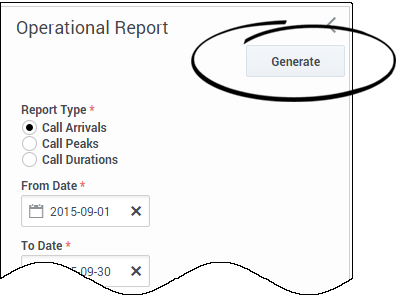
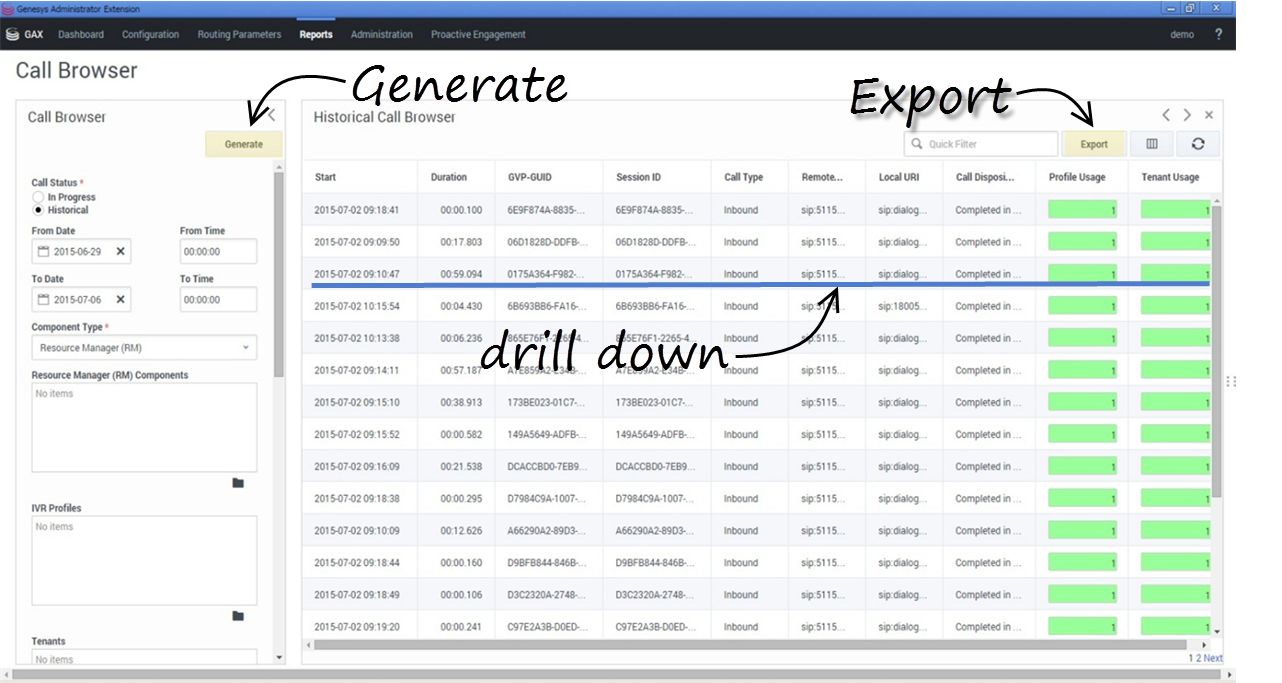
You clicked Generate to populate the table with the data types you selected in the filter dialog.
Now click a row to underline (select) it, then double-click to "drill down"—see more detail about that row in a new table to the right (and usually off the screen). You can continue to drill down, and generate new details in new tables, as long as you can select a line.
Click the Export button to save all generated (in other words, currently viewable) data to a file—including data that is off the screen but you could scroll to see.
GVP Report display controls
The controls listed below are for data table panels that appear to the right of the filter column. You don't need to know all of them, just the commands that will show you the most useful data. The controls listed below are for data table panels that appear to the right of the filter column. You don't need to know all of them, just the commands that will show you the most useful data.
| What it is | How to control it |
|---|---|
| Data row | Click to drill down on the data row for more detail on that row alone. The details appear in a new window to the right of the existing window, and the nature of those details depends upon the nature of the data row. For example, if the data is a historical list of calls, clicking on one row displays a Call Details window with information about the call that you selected. |
| Pagination bar | Displays pagination information for the report, if it is saved in CSV format. |
| Column heading | Click to sort the entire table by the selected column . Click-and-drag to move a column. |
| Next Range and Previous Range buttons |
Click to generate a related new report based on the current time frame, but a shifted time range. These controls are available only in Operational Reports and VAR Reports. |
| Quick Filter field | Enter text that must appear in a data row for the row to be displayed. |
| Export button | Click to save the displayed pages of data to a file of comma-separated values, using an automatically generated name that follows this convention:
user_gvp_rpt_report type.date generated.csv
|
| Tenant Filter | Select one or more tenants from the list that appears when you click the solid file folder icon. |
| Call Disposition | Select a Call Disposition from the drop-down list. |

