Architecture
Learn about Telemetry Service architecture
Introduction
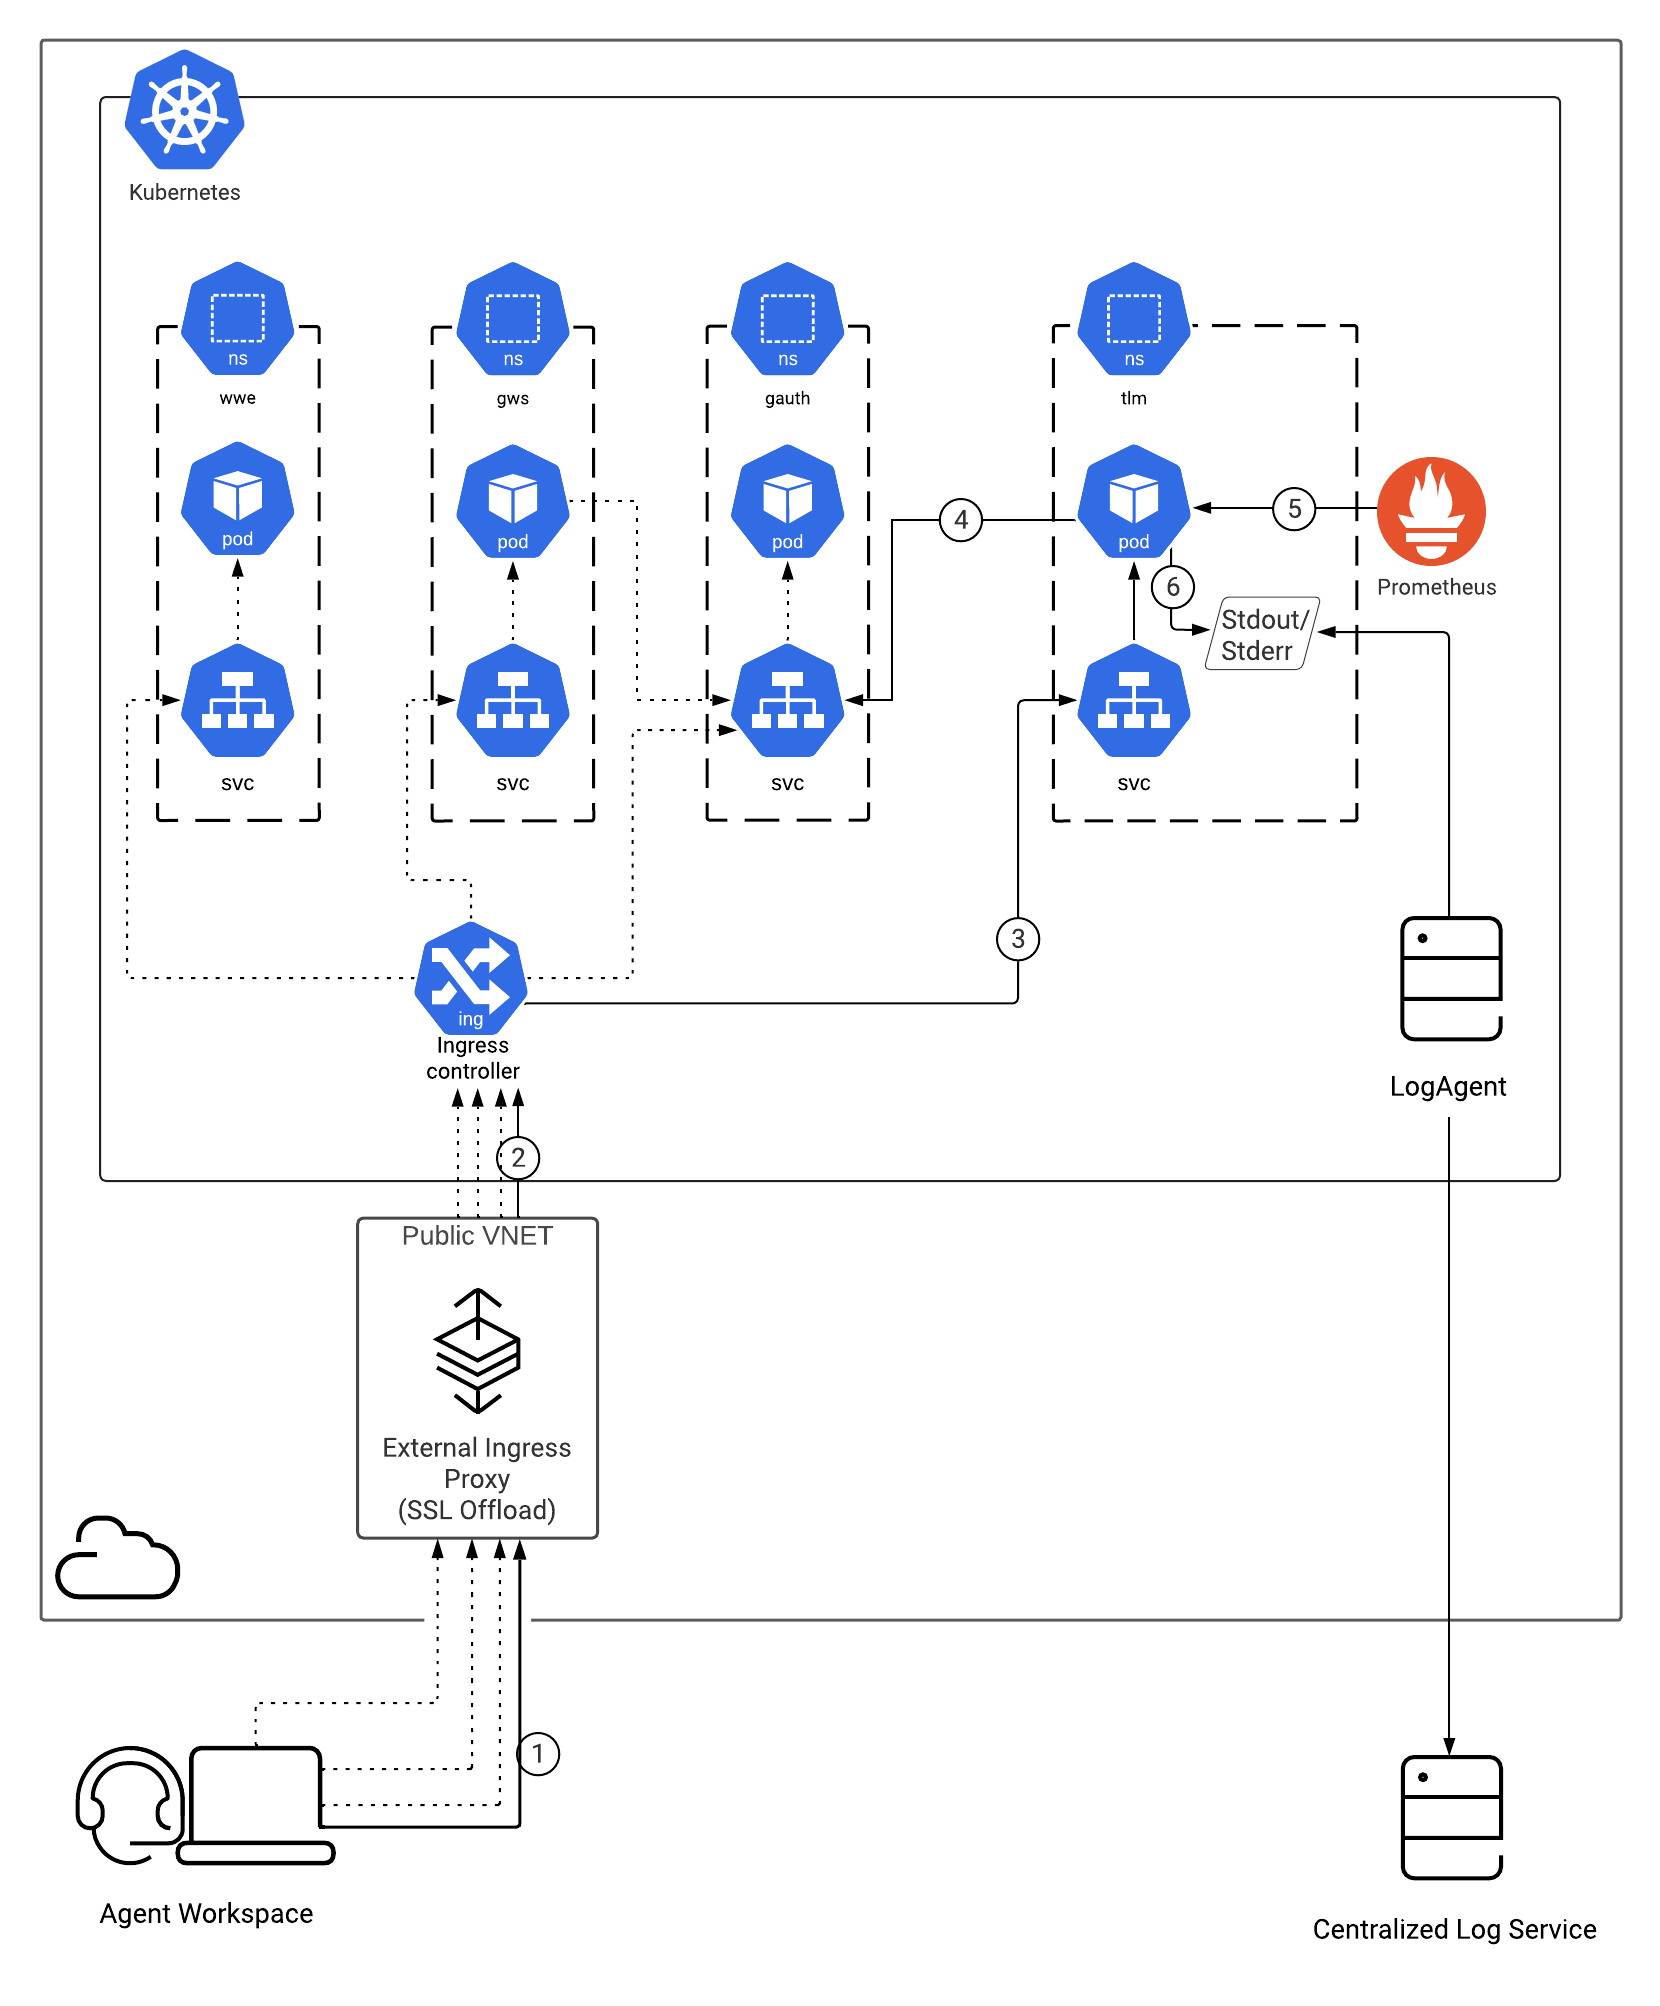
In the architecture diagram, the dotted lines from the browser (going through External Ingress and Ingress Controller) and from gws service pods (intra-cluster), to the non-tlm namespace resources, represents the connectivity required by WWE to set-up an authorized connection to the Telemetry Service. Refer to the following documentation for details about their respective connectivity:
- Genesys Authentication Private Edition Guide
- Genesys Web Services and Applications Private Edition Guide
- Workspace Web Edition Private Edition Guide
For information about the overall architecture of Genesys Multicloud CX private edition, see the high-level Architecture page.
See also High availability and disaster recovery for information about high availability/disaster recovery architecture.
Architecture diagram — Connections
The numbers on the connection lines refer to the connection numbers in the table that follows the diagram. The direction of the arrows indicates where the connection is initiated (the source) and where an initiated connection connects to (the destination), from the point of view of Telemetry Service as a service in the network.
Connections table
The connection numbers refer to the numbers on the connection lines in the diagram. The Source, Destination, and Connection Classification columns in the table relate to the direction of the arrows in the Connections diagram above: The source is where the connection is initiated, and the destination is where an initiated connection connects to, from the point of view of Telemetry Service as a service in the network. Egress means the Telemetry Service service is the source, and Ingress means the Telemetry Service service is the destination. Intra-cluster means the connection is between services in the cluster.
| Connection | Source | Destination | Protocol | Port | Classification | Data that travels on this connection |
|---|---|---|---|---|---|---|
| 1 | Browser | Inbound Gateway | HTTPS | 443 | Ingress | Inbound web traffic |
| 2 | Ingress proxy | Ingress controller | HTTPS | 443 | Intra-cluster | Inbound web traffic |
| 3 | Ingress controller | Telemetry Service | HTTP | 8107 | Intra-cluster | Ingress controller connects to Telemetry pod |
| 4 | Genesys Authentication | HTTP | 80 | Intra-cluster | Telemetry queries the Genesys Authentication Service to validate user identity. | |
| 5 | Prometheus | Telemetry Service | HTTP | 9107 | Intra-cluster | Prometheus connects to Telemetry service for metrics scraping. |
| 6 | Telemetry Service | Stdout/Stderr | Intra-cluster | Structured logs of Telemetry Service and structured logs captured from Telemetry clients. |

