Grafana configuration
Contents
Learn about how to use Grafana to set up a monitoring solution for your services.
Grafana in GKE
Google Cloud Monitoring in Grafana
For details about cloud monitoring in Grafana, refer to https://grafana.com/docs/grafana/latest/datasources/google-cloud-monitoring/.
Deploying Prometheus
Prerequisites
- Create a namespace for deploying Prometheus operator.
- Clone or download source from https://github.com/prometheus-operator/kube-prometheus.
- Make sure you remove the Grafana files. Grafana is deployed using the operator.
Steps to deploy Prometheus
- Run the setup from the root of downloaded source. This deploys the Prometheus operator and CRDs.
kubectl create-fmanifests/setup
- For Prometheus to scrape the cluster (all namespaces), edit prometheus-clusterRole.yaml.
metadata:
  labels:
    app.kubernetes.io/component: prometheus
    app.kubernetes.io/name: prometheus
    app.kubernetes.io/part-of: kube-prometheus
    app.kubernetes.io/version: 2.30.0
  name: prometheus-k8s
rules:
- apiGroups:
  - ""
  resources:
  - nodes/metrics
  verbs:
  - get
- nonResourceURLs:
  - /metrics
  verbs:
  - get
- apiGroups:
  - ""
  resources:
  - services
  - pods
  - endpoints
  verbs:
  - get
  - list
  - watch
- After the setup is complete, execute the following command:
kubectl create -f manifests/- This deploys the following components.
- Deploy required components
kubectl create-fmanifests/
Deploying Grafana
Configuring Grafana
The community-powered Grafana is deployed in a new namespace (ex. monitoring) . Follow the instructions to deploy Grafana in GKE.
Installing using Command Line Interface
Download/clone the Grafana operator rom https://github.com/integr8ly/grafana-operator and change the working directory to grafana-operator-xx.
Steps to deploy Grafana operator manually
- Create a new namespace or switch to a namespace (for example: monitoring) where Prometheus is deployed.
$ kubectl create -f config/crd/bases
- Create operator roles.
$ kubectl create -f deploy/roles
- Modify ClusterRoleBinding (cluster_role_binding_grafana_operator.yaml). The namespace must be updated with the current namespace where Grafana is deployed (for example: monitoring).
apiVersion: rbac.authorization.k8s.io/v1

kind: ClusterRoleBinding

metadata:

 name: grafana-operator

roleRef:

 name: grafana-operator

 kind: ClusterRole

 apiGroup: ""

subjects:

 - kind: ServiceAccount

   name: grafana-operator

   namespace: monitoring
- Scan for dashboards in other namespaces you also need the cluster roles.
$ kubectl create -f deploy/cluster_roles
- To scan dashboards deployed in all namespaces, --scan-all should be added to operator container as argument.
- --scan-all: watch for dashboards in all namespaces. This requires the operator service account to have cluster wide permissions to get, list, update and watch dashboards.
- Deploy the operator to that namespace you can use deploy/operator.yaml.
containers:

 - name: grafana-operator

   image: quay.io/integreatly/grafana-operator:vX.X.X

   args:

     - '--scan-all'
- Deploy the operator to that namespace. You can use deploy/operator.yaml
$ kubectl create -f deploy/operator.yaml -n <namespace>
- Check the status of the operator pod.
Grafana Plugins
If a data source or dashboard requires a plugin, it can be added in the dashboard itself or it can be added as custom environment variable to the Grafana deployment.
Install plugins using Grafana environment variable
The operator allows you to pass custom environment variable to the Grafana deployment. This means that you can set the GF_INSTALL_PLUGINS flag, as described.
- Create and deploy the secret kubectl create -f <secret-name>.yaml -n <namespace>.
apiVersion: v1

kind: Secret

metadata:

 name: <secret-name>

type: Opaque

stringData:

 GF_INSTALL_PLUGINS: <plugin-name> <plugin-version>

Add the section to Grafana CR.

deployment:

 envFrom:

   '''-''' secretRef:

       name: <secret-name>
Creating Grafana Instance
- Modify Grafana.yaml with the required values before creating Grafana instance. Update name and add hostname if ingress is enabled.
apiVersion: integreatly.org/v1alpha1

kind: Grafana

metadata:

name: grafana-app

spec:

client:

preferService: true

ingress:

enabled: True

hostname: "grafana.gke1-uswest1.gcpe001.gencpe.com"

pathType: Prefix

path: "/"

config:

log:

mode: "console"

level: "error"

log.frontend:

enabled: true

auth:

disable_login_form: False

disable_signout_menu: True

auth.anonymous:

enabled: True

service:

name: "grafana-service"

labels:

app: "grafana"

type: "grafana-service"

dashboardLabelSelector:

- matchExpressions:

- { key: app, operator: In, values: [grafana] }

resources:

Optionally specify container resources

limits:

cpu: 200m

memory: 200Mi

requests:

cpu: 100m
- Create a new Grafana instance in the namespace.
$ kubectl create -f deploy/examples/Grafana.yaml -n <namespace>
- Retrieve the Grafana UI login admin credentials.
$ echo "User: admin"

$ echo "Password: $(oc get secret <secret-name> --namespace <namespace> -o jsonpath="{.data.GF_SECURITY_ADMIN_PASSWORD}" | base64 --decode)"
Connecting Prometheus to custom Grafana
Deploy Grafana data source kubectl create -f <filename> -n <namespace>. If Grafana instance is deleted and redeployed, you must delete and redeploy Grafana data source as well.
apiVersion: integreatly.org/v1alpha1
kind: GrafanaDataSource
metadata:
  name: grafana-datasource
  namespace: monitoring
spec:
  datasources:
    - access: proxy
      editable: true
      isDefault: true
      name: Prometheus
      type: prometheus
      url: 'http://prometheus-k8s.monitoring.svc:9090'
  name: grafana-datasource.yaml
Grafana dashboards
Importing custom dashboards
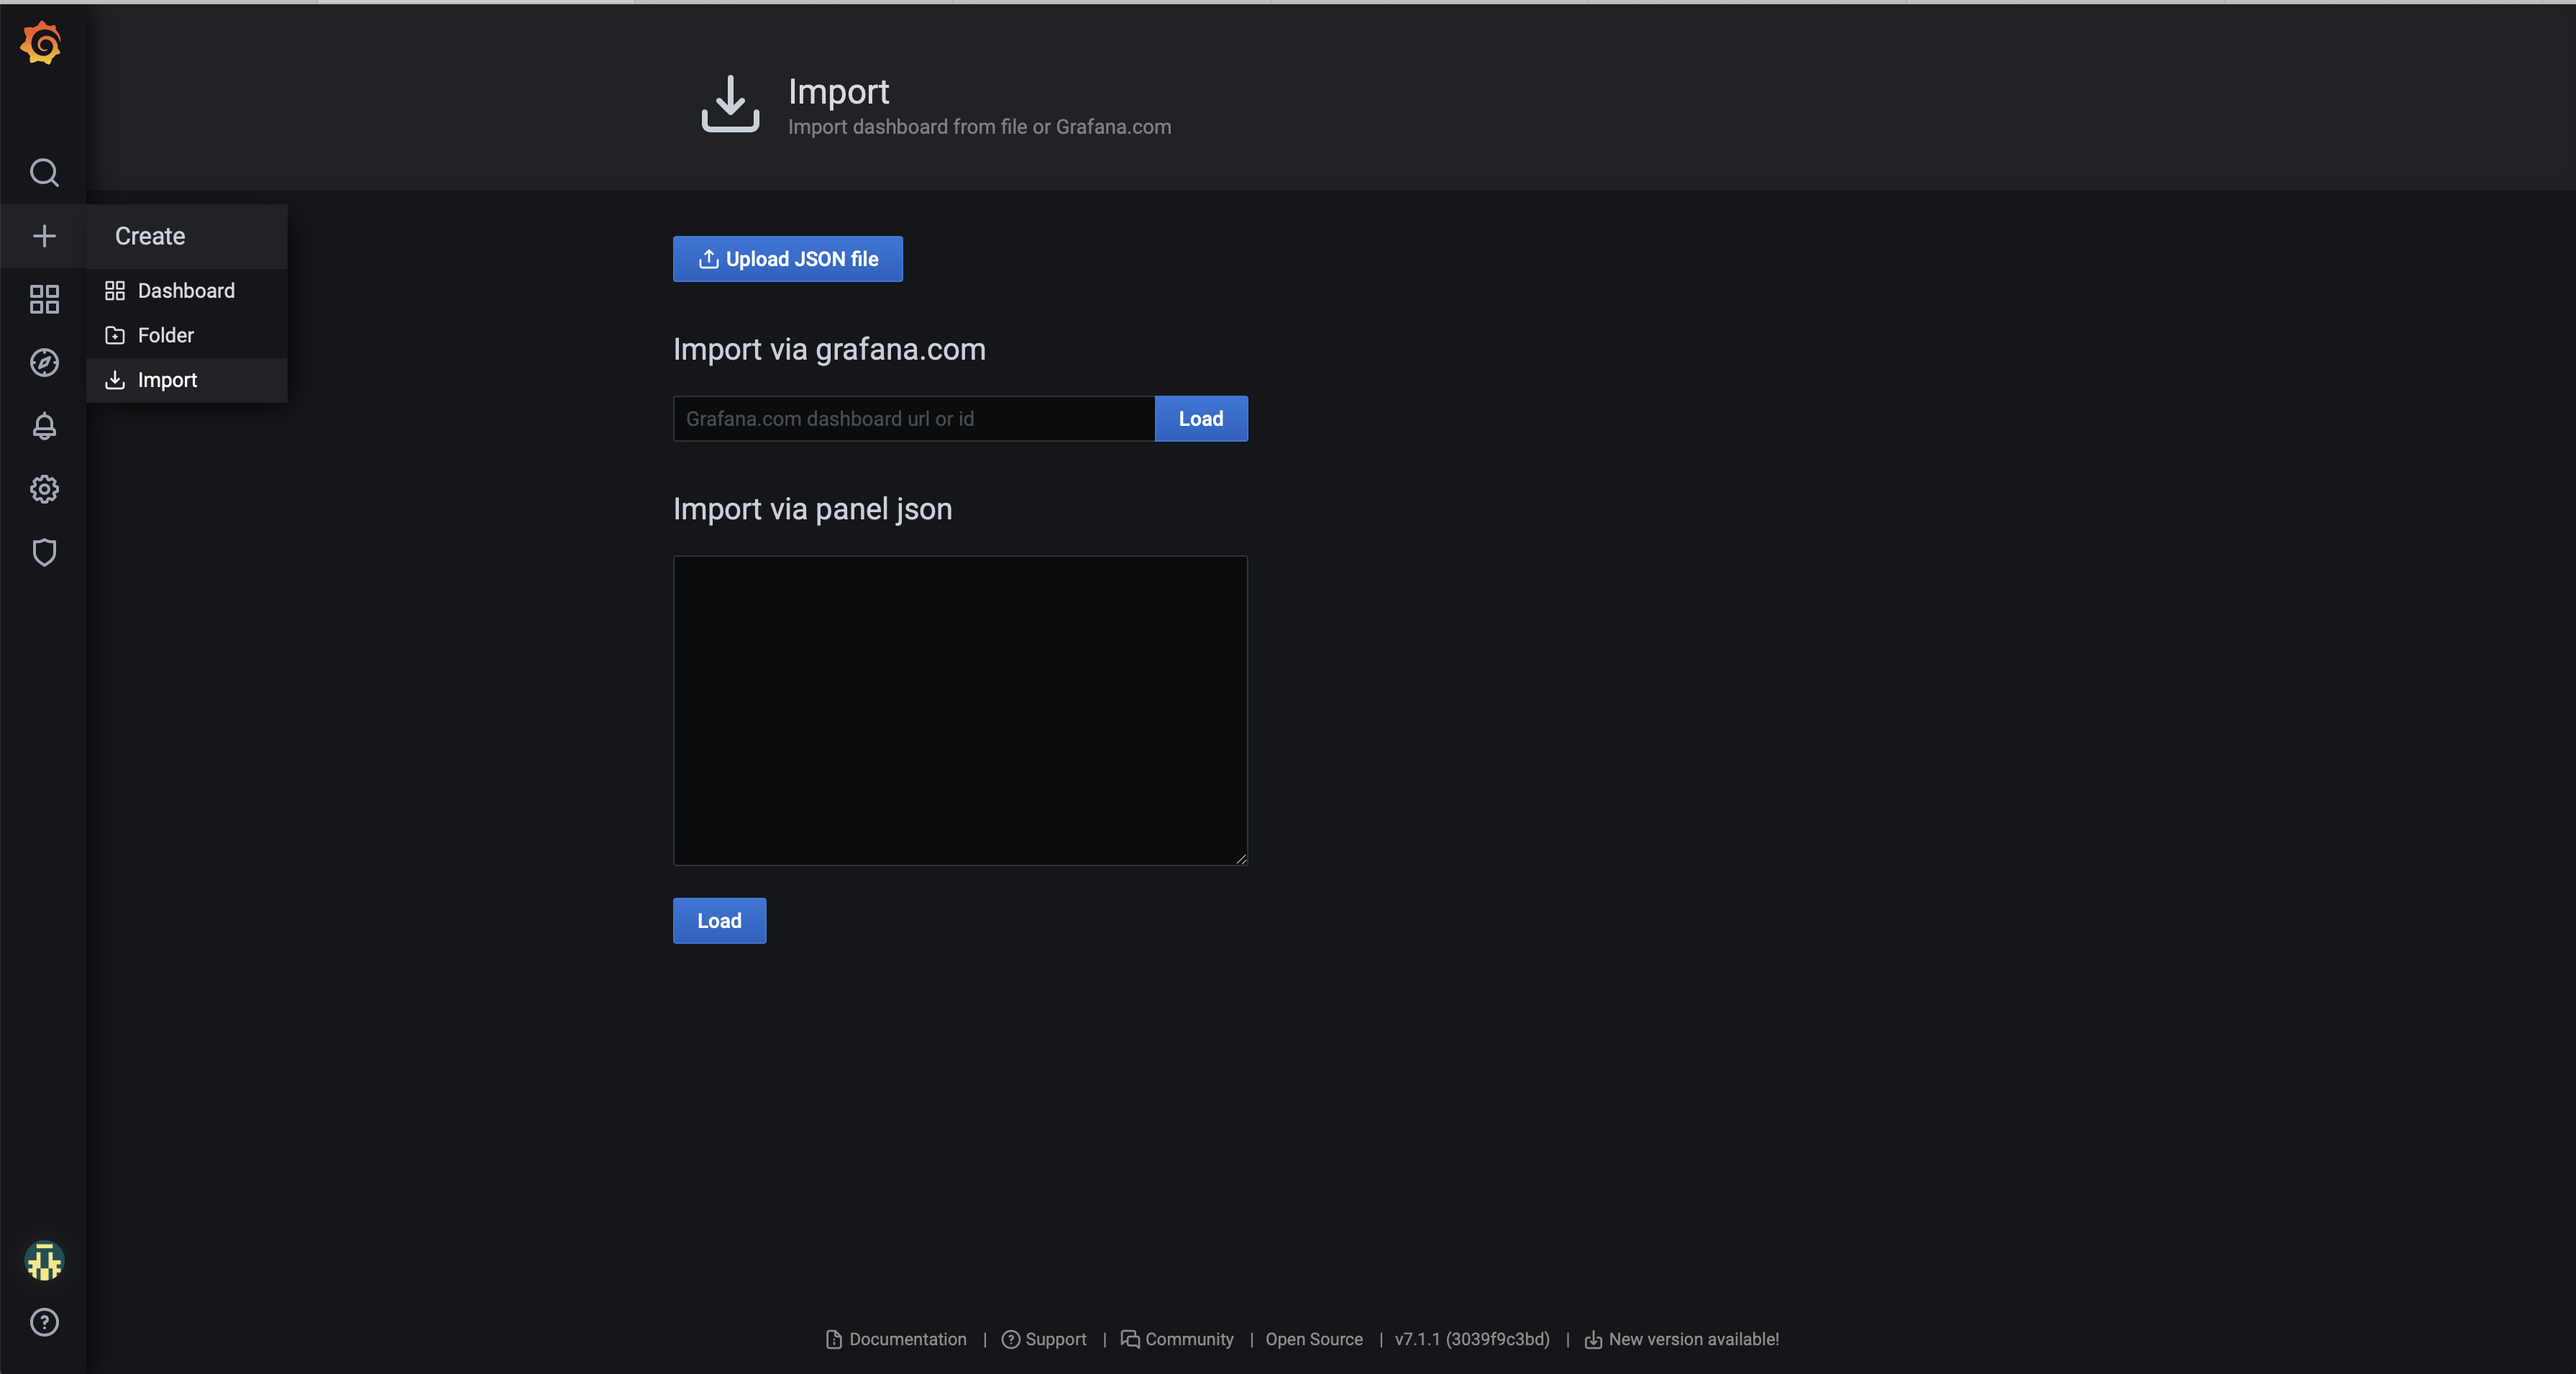
To import a custom Grafana dashboard from a JSON file within Grafana, click Import and then click Upload Json file as shown in the following screenshot:
Creating Grafana dashboards
To create Grafana dashboard, use the following template:
apiVersion: integreatly.org/v1alpha1
kind: GrafanaDashboard
metadata:
  name: <name>
  namespace: <namespace>
  labels:
    app: grafana --> label should match the dashboardLabelSelector defined in Grafana operator
spec:
  customFolderName: "folder name"
  json:
    ""
  configMapRef:
    name: <Configmap-name>
    key: <key>
---
apiVersion: v1
kind: ConfigMap
metadata:
  name: voice-sips-dashboard-from-cm
data:
  <key>: |-
 <dashboard>
You can deploy new customized dashboards. You can either deploy them as Grafana dashboard in the namespace or it can be directly loaded on to the Grafana UI. Refer to https://github.com/integr8ly/grafana-operator/tree/master/deploy/examples/dashboards for more details about different ways to deploy a dashboard.

