Difference between revisions of "PEC-REP/Current/RT/RTRDashboardExample"
From Genesys Documentation
m (Text replacement - "\|Platform=([^\|]*)GenesysEngage-onpremises([\|]*)" to "|Platform=$1GenesysEngage-cloud$2") |
(Published) |
||
| Line 8: | Line 8: | ||
|Role=Administrator, Supervisor | |Role=Administrator, Supervisor | ||
|Application=Pulse Reporting | |Application=Pulse Reporting | ||
| − | |||
|Section={{Section | |Section={{Section | ||
| − | |||
|anchor=Dashboardexamples | |anchor=Dashboardexamples | ||
|alignment=Vertical | |alignment=Vertical | ||
| − | |||
| − | |||
|structuredtext=You can use the following examples to help you decide which real-time reports to display on your dashboard or wallboard. | |structuredtext=You can use the following examples to help you decide which real-time reports to display on your dashboard or wallboard. | ||
| − | |||
| − | |||
|Status=No | |Status=No | ||
}}{{Section | }}{{Section | ||
| Line 23: | Line 17: | ||
|anchor=Dashboardexamples | |anchor=Dashboardexamples | ||
|alignment=Vertical | |alignment=Vertical | ||
| − | |||
| − | |||
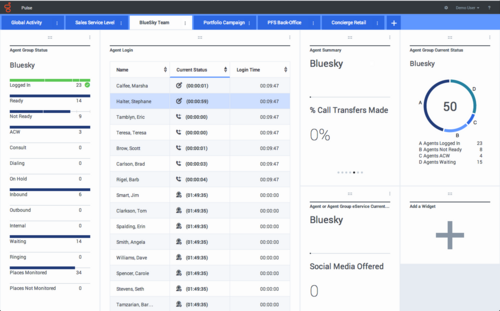
|structuredtext====Sales team lead dashboard=== | |structuredtext====Sales team lead dashboard=== | ||
| − | [[File: | + | [[File:Pulse9.0_SalesTLDash.png|center|500px]] |
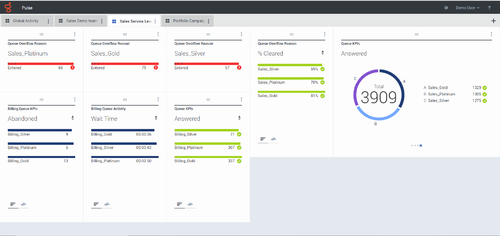
===Sales service level dashboard for a supervisor=== | ===Sales service level dashboard for a supervisor=== | ||
| − | [[File: | + | [[File:Pulse9.0_SalesSLDash.png|center|500px]] |
===Multi-channel dashboard for a supervisor=== | ===Multi-channel dashboard for a supervisor=== | ||
| − | [[File: | + | [[File:Pulse9.0_SupMultiChanDash.png|center|500px]] |
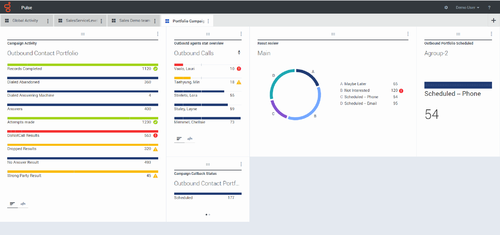
===Outbound campaign dashboard for a supervisor=== | ===Outbound campaign dashboard for a supervisor=== | ||
| − | [[File: | + | [[File:Pulse9.0_SupOutboundDash.png|center|500px]] |
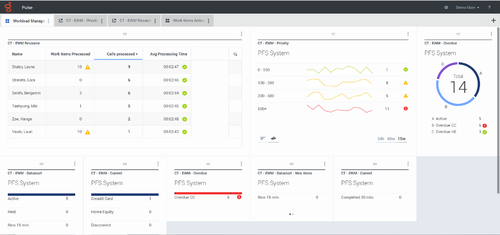
===Back-office dashboard for a supervisor=== | ===Back-office dashboard for a supervisor=== | ||
| − | [[File: | + | [[File:Pulse9.0_SupBackOfficeDash.png|center|500px]] |
| − | |||
| − | |||
|Status=No | |Status=No | ||
}}{{Section | }}{{Section | ||
| Line 46: | Line 36: | ||
|anchor=Wallboardexample | |anchor=Wallboardexample | ||
|alignment=Vertical | |alignment=Vertical | ||
| − | |||
| − | |||
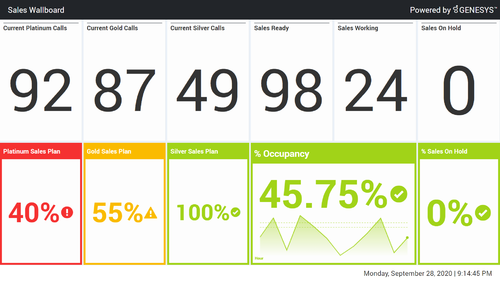
|structuredtext====Sales wallboard=== | |structuredtext====Sales wallboard=== | ||
| − | [[File: | + | [[File:Pulse9.0_SalesWall.png|center|500px]] |
| − | |||
| − | |||
|Status=No | |Status=No | ||
}} | }} | ||
}} | }} | ||
Revision as of 18:51, October 14, 2020
Contents
View examples of dashboards and wallboards to help you choose what you want to display.
Related documentation:
You can use the following examples to help you decide which real-time reports to display on your dashboard or wallboard.
Dashboard examples
Sales team lead dashboard
Sales service level dashboard for a supervisor
Multi-channel dashboard for a supervisor
Outbound campaign dashboard for a supervisor
Back-office dashboard for a supervisor
Wallboard example
Comments or questions about this documentation? Contact us for support!

