Difference between revisions of "PEC-REP/Current/RT/RTRStatProperties"
(Published) |
(Published) |
||
| (3 intermediate revisions by 2 users not shown) | |||
| Line 6: | Line 6: | ||
|Dimension=RealTime | |Dimension=RealTime | ||
|ComingSoon=No | |ComingSoon=No | ||
| − | |Platform= | + | |Platform=GenesysEngage-cloud |
|Role=Supervisor | |Role=Supervisor | ||
|Application=Pulse Reporting | |Application=Pulse Reporting | ||
| − | |||
|Section={{Section | |Section={{Section | ||
| − | |||
| − | |||
|alignment=Vertical | |alignment=Vertical | ||
| − | |||
| − | |||
|structuredtext=When you select a statistic within the {{Link-SomewhereInThisManual|topic=RTRTemplates|anchor=top|display text=template wizard}}, Genesys Pulse displays the values of the statistic properties that are described below. | |structuredtext=When you select a statistic within the {{Link-SomewhereInThisManual|topic=RTRTemplates|anchor=top|display text=template wizard}}, Genesys Pulse displays the values of the statistic properties that are described below. | ||
{{NoteFormat|You can modify a statistic definition while defining a template. See {{Link-SomewhereInThisManual|topic=RTRTemplatesA|anchor=top|display text=Standard Report Templates}}.|2}} | {{NoteFormat|You can modify a statistic definition while defining a template. See {{Link-SomewhereInThisManual|topic=RTRTemplatesA|anchor=top|display text=Standard Report Templates}}.|2}} | ||
| − | |||
| − | |||
|Status=No | |Status=No | ||
}}{{Section | }}{{Section | ||
| Line 26: | Line 19: | ||
|anchor=Alias | |anchor=Alias | ||
|alignment=Vertical | |alignment=Vertical | ||
| − | |||
| − | |||
|structuredtext=The Alias must be a unique name that represents the technical name of the statistic. Use an ASCII letter for the first character. | |structuredtext=The Alias must be a unique name that represents the technical name of the statistic. Use an ASCII letter for the first character. | ||
| − | |||
| − | |||
|Status=No | |Status=No | ||
}}{{Section | }}{{Section | ||
| Line 36: | Line 25: | ||
|anchor=DisplayAlias | |anchor=DisplayAlias | ||
|alignment=Vertical | |alignment=Vertical | ||
| − | |||
| − | |||
|structuredtext=The Display Alias is the name displayed on the report. | |structuredtext=The Display Alias is the name displayed on the report. | ||
| − | |||
| − | |||
|Status=No | |Status=No | ||
}}{{Section | }}{{Section | ||
| Line 46: | Line 31: | ||
|anchor=Description | |anchor=Description | ||
|alignment=Vertical | |alignment=Vertical | ||
| − | |||
| − | |||
|structuredtext=The Description provides the functional meaning of the statistic. | |structuredtext=The Description provides the functional meaning of the statistic. | ||
| − | |||
| − | |||
|Status=No | |Status=No | ||
}}{{Section | }}{{Section | ||
| Line 56: | Line 37: | ||
|anchor=DisplayFormat | |anchor=DisplayFormat | ||
|alignment=Vertical | |alignment=Vertical | ||
| − | |||
| − | |||
|structuredtext=The Display Format specifies whether values are shown as time or numbers, and, if numbers, the number of decimal places. Depending on the statistic you chose, the available formats in the drop-down list are time-based or numerical. | |structuredtext=The Display Format specifies whether values are shown as time or numbers, and, if numbers, the number of decimal places. Depending on the statistic you chose, the available formats in the drop-down list are time-based or numerical. | ||
| Line 70: | Line 49: | ||
*<tt>Show 'Do Not Disturb' when applicable</tt>Agent Status Display Options | *<tt>Show 'Do Not Disturb' when applicable</tt>Agent Status Display Options | ||
| − | [[File:AgentStatusFormat9.0.001.png|thumb]] | + | [[File:AgentStatusFormat9.0.001.png|thumb|alt=From the Statistics window, you can add, edit, or delete new statistic parameters.]] |
Starting with release 9.0.001, the <tt>Advanced Display Options Editor</tt> is available for the <tt>Status</tt> display format. It allows to fully replace the standard representation with a user-designed representation based on the [https://developer.mozilla.org/en-US/docs/Web/JavaScript/Reference/Template_literals JavaScript string literals syntax]. | Starting with release 9.0.001, the <tt>Advanced Display Options Editor</tt> is available for the <tt>Status</tt> display format. It allows to fully replace the standard representation with a user-designed representation based on the [https://developer.mozilla.org/en-US/docs/Web/JavaScript/Reference/Template_literals JavaScript string literals syntax]. | ||
| Line 88: | Line 67: | ||
!Displayed data example | !Displayed data example | ||
{{!}}- | {{!}}- | ||
| − | {{!}}<nowiki>${media && !dnd ? media + " | + | {{!}}<nowiki>${media && !dnd ? media + " {{!}}{{!}} ": ""}${status}(${duration})</nowiki> |
(standard format representation when all Status properties are checked) | (standard format representation when all Status properties are checked) | ||
| − | {{!}}<nowiki>voice | + | {{!}}<nowiki>voice {{!}}{{!}} WaitForNextCall(00:23:12)</nowiki> <br> |
or <br> | or <br> | ||
LoggedOut(01:20:15) <br> | LoggedOut(01:20:15) <br> | ||
| Line 102: | Line 81: | ||
{{!}}} | {{!}}} | ||
<br /> | <br /> | ||
| − | |||
| − | |||
|Status=No | |Status=No | ||
}}{{Section | }}{{Section | ||
|sectionHeading=Filter Out LoggedOut Agents | |sectionHeading=Filter Out LoggedOut Agents | ||
| − | |||
|alignment=Horizontal | |alignment=Horizontal | ||
|Media=Image | |Media=Image | ||
|image=Pulse_90_filter_logged_out.png | |image=Pulse_90_filter_logged_out.png | ||
| + | |AltText=Checking the Filter out Logged Out Agents checkbox hides any agents who are logged out from the template statistics. | ||
|structuredtext=You can filter agents in the <tt>LoggedOut</tt> status from your reports within a report template. The <tt>Filter Out LoggedOut Agents</tt> option works in conjunction with the <tt>Current Status</tt> statistics, which are based on the <tt>ExtendedCurrentStatus</tt> stat type. Once enabled, the <tt>Filter Out LoggedOut Agents</tt> option is applied to all statistics in the template. | |structuredtext=You can filter agents in the <tt>LoggedOut</tt> status from your reports within a report template. The <tt>Filter Out LoggedOut Agents</tt> option works in conjunction with the <tt>Current Status</tt> statistics, which are based on the <tt>ExtendedCurrentStatus</tt> stat type. Once enabled, the <tt>Filter Out LoggedOut Agents</tt> option is applied to all statistics in the template. | ||
| − | |||
| − | |||
|Status=No | |Status=No | ||
}}{{Section | }}{{Section | ||
|sectionHeading=Filters | |sectionHeading=Filters | ||
| − | |||
|alignment=Horizontal | |alignment=Horizontal | ||
|Media=Image | |Media=Image | ||
|image=Pulse_85105_StatOptions4.png | |image=Pulse_85105_StatOptions4.png | ||
| + | |AltText=To add, edit or delete a statistical filter, go to the Application Options tab found under the Configuration section of GAX. | ||
|structuredtext=The Filters represent statistical filters that define restrictive conditions on actions used while calculating the statistic. | |structuredtext=The Filters represent statistical filters that define restrictive conditions on actions used while calculating the statistic. | ||
| Line 137: | Line 112: | ||
Now, when an agent attaches the "Spanish/Language" key-value pair to calls from a desktop application, the calls are filtered out of statistical calculations. | Now, when an agent attaches the "Spanish/Language" key-value pair to calls from a desktop application, the calls are filtered out of statistical calculations. | ||
| − | |||
|Status=No | |Status=No | ||
}}{{Section | }}{{Section | ||
|sectionHeading=Formula | |sectionHeading=Formula | ||
| − | |||
|alignment=Horizontal | |alignment=Horizontal | ||
|Media=Image | |Media=Image | ||
|image=Pulse_85105_Formulas2.png | |image=Pulse_85105_Formulas2.png | ||
| + | |AltText=Check the Formula checkbox to create or customize statistics such as the ratio of the calls abandoned versus calls in queue. | ||
|structuredtext=From the statistic detail pane, you can create or customize statistics by creating a {{Link-SomewhereInThisManual|topic=RTRFormulas|anchor=top|display text=formula}}. | |structuredtext=From the statistic detail pane, you can create or customize statistics by creating a {{Link-SomewhereInThisManual|topic=RTRFormulas|anchor=top|display text=formula}}. | ||
| Line 156: | Line 130: | ||
For example, here is a formula using the function <tt>G.GetAgentNonVoiceStatus()</tt>:<br /> | For example, here is a formula using the function <tt>G.GetAgentNonVoiceStatus()</tt>:<br /> | ||
<source lang="Java">Result = G.GetAgentNonVoiceStatus(Data.Current_Status.Value, email);</source> | <source lang="Java">Result = G.GetAgentNonVoiceStatus(Data.Current_Status.Value, email);</source> | ||
| − | |||
|Status=No | |Status=No | ||
}}{{Section | }}{{Section | ||
|sectionHeading=GroupBy | |sectionHeading=GroupBy | ||
| − | |||
|alignment=Horizontal | |alignment=Horizontal | ||
|Media=Image | |Media=Image | ||
|image=Pulse_85105_GroupBy.png | |image=Pulse_85105_GroupBy.png | ||
| + | |AltText=Click the arrow next to an agent's name to expand any multi-dimensional data. | ||
|structuredtext=The <tt>GroupByColumns</tt> option facilitates provisioning of Pulse widgets and enable multi-dimensional data presentation (<tt>GroupBy</tt> capability) in Grid widgets and in the Data view on an expanded widget tab. | |structuredtext=The <tt>GroupByColumns</tt> option facilitates provisioning of Pulse widgets and enable multi-dimensional data presentation (<tt>GroupBy</tt> capability) in Grid widgets and in the Data view on an expanded widget tab. | ||
| Line 194: | Line 167: | ||
You can use '''Group by Columns''' option when you create a template: | You can use '''Group by Columns''' option when you create a template: | ||
| − | [[File:Pulse_85105_StatGroupBy.png|thumb|left]] | + | [[File:Pulse_85105_StatGroupBy.png|thumb|left|alt=You'll find the Group By Columns field in the Agent Login Template, under the Display Options tab, under the Agent Object Type.]] |
| − | |||
|Status=No | |Status=No | ||
}}{{Section | }}{{Section | ||
| Line 201: | Line 173: | ||
|anchor=Insensitivity | |anchor=Insensitivity | ||
|alignment=Vertical | |alignment=Vertical | ||
| − | |||
| − | |||
|structuredtext=Insensitivity describes a condition for Stat Server to send updates of statistical values to its clients. An increase in the value of this parameter usually decreases network traffic, but it also reduces reporting accuracy, because values are not updated as frequently. This setting is not visible in Stat Server configuration, but rather, clients pass its value to Stat Server along with each statistic request. | |structuredtext=Insensitivity describes a condition for Stat Server to send updates of statistical values to its clients. An increase in the value of this parameter usually decreases network traffic, but it also reduces reporting accuracy, because values are not updated as frequently. This setting is not visible in Stat Server configuration, but rather, clients pass its value to Stat Server along with each statistic request. | ||
| Line 208: | Line 178: | ||
For example, if the result has a long integer data type—as is the case for statistics measuring time—Stat Server uses the absolute difference in values for comparison. Given an Insensitivity setting of 5 in this case, Stat Server sends the recalculated result to its client when the absolute value of the difference between the new and old result is at least 5 (seconds, usually). | For example, if the result has a long integer data type—as is the case for statistics measuring time—Stat Server uses the absolute difference in values for comparison. Given an Insensitivity setting of 5 in this case, Stat Server sends the recalculated result to its client when the absolute value of the difference between the new and old result is at least 5 (seconds, usually). | ||
| − | |||
| − | |||
|Status=No | |Status=No | ||
}}{{Section | }}{{Section | ||
| Line 215: | Line 183: | ||
|anchor=NotificationMode | |anchor=NotificationMode | ||
|alignment=Vertical | |alignment=Vertical | ||
| − | |||
| − | |||
|structuredtext=The Notification Mode determines when Stat Server sends updated statistical values. These are the valid options: | |structuredtext=The Notification Mode determines when Stat Server sends updated statistical values. These are the valid options: | ||
| Line 223: | Line 189: | ||
*'''No Notification'''—Select this option to instruct Stat Server to not report updates. Updates are turned off in this case. | *'''No Notification'''—Select this option to instruct Stat Server to not report updates. Updates are turned off in this case. | ||
*'''Reset-Based'''—Select this Notification Mode to instruct Stat Server to report Genesys Pulse value right before setting it to zero (0). CurrentState statistics cannot be requested with Reset-Based notification mode. | *'''Reset-Based'''—Select this Notification Mode to instruct Stat Server to report Genesys Pulse value right before setting it to zero (0). CurrentState statistics cannot be requested with Reset-Based notification mode. | ||
| − | |||
| − | |||
|Status=No | |Status=No | ||
}}{{Section | }}{{Section | ||
| Line 230: | Line 194: | ||
|anchor=NotificationFrequency | |anchor=NotificationFrequency | ||
|alignment=Vertical | |alignment=Vertical | ||
| − | |||
| − | |||
|structuredtext=Use Notification Frequency to set how often, in seconds, Stat Server recalculates the statistic and notifies Genesys Pulse if the statistic changes by more than the valued displayed in the Insensitivity field. This field is only used when a Time-Based Notification Mode is selected for the statistic. | |structuredtext=Use Notification Frequency to set how often, in seconds, Stat Server recalculates the statistic and notifies Genesys Pulse if the statistic changes by more than the valued displayed in the Insensitivity field. This field is only used when a Time-Based Notification Mode is selected for the statistic. | ||
| − | |||
| − | |||
|Status=No | |Status=No | ||
}}{{Section | }}{{Section | ||
|sectionHeading=Statistic Type | |sectionHeading=Statistic Type | ||
| − | |||
|alignment=Horizontal | |alignment=Horizontal | ||
|Media=Image | |Media=Image | ||
|image=Pulse_85105_StatOptions.png | |image=Pulse_85105_StatOptions.png | ||
| + | |AltText=From the Configuration menu, navigate to Stat Server Properties, and Application Options to find a list of Statistic Types. | ||
|structuredtext=The mandatory Statistic Type displays the parameters that define the statistic type within Stat Server. | |structuredtext=The mandatory Statistic Type displays the parameters that define the statistic type within Stat Server. | ||
| Line 251: | Line 211: | ||
This list should be the same as the list of statistic types detailed in the Genesys Pulse templates spreadsheet. | This list should be the same as the list of statistic types detailed in the Genesys Pulse templates spreadsheet. | ||
| − | |||
| − | |||
| − | |||
|Status=No | |Status=No | ||
}}{{Section | }}{{Section | ||
|sectionHeading=Time Profile | |sectionHeading=Time Profile | ||
| − | |||
|alignment=Horizontal | |alignment=Horizontal | ||
|Media=Image | |Media=Image | ||
|image=Pulse_85105_StatOptions2.png | |image=Pulse_85105_StatOptions2.png | ||
| + | |AltText=From the Configuration menu, navigate to Stat Server Properties, then Application Options, to find the list of Time Profiles. | ||
|structuredtext=Use the Time Profile to define the Time Profile for the statistic and specify the interval over which historical aggregate values are calculated. All time profiles are defined as configuration options in the Time Profiles of the Stat Server Application object in Genesys Configuration. | |structuredtext=Use the Time Profile to define the Time Profile for the statistic and specify the interval over which historical aggregate values are calculated. All time profiles are defined as configuration options in the Time Profiles of the Stat Server Application object in Genesys Configuration. | ||
| Line 281: | Line 238: | ||
*SinceLogin,SinceLogin—SinceLogin resets statistics to zero ('''0''') at the moment of agent login. Statistics continue to accumulate as long as the agent is logged into (any) DN. The SinceLogin interval type aggregates statistical data only for agent-object statistics. | *SinceLogin,SinceLogin—SinceLogin resets statistics to zero ('''0''') at the moment of agent login. Statistics continue to accumulate as long as the agent is logged into (any) DN. The SinceLogin interval type aggregates statistical data only for agent-object statistics. | ||
*Shifts,Growing—A time profile named Shifts resets statistics to zero when shifts change at 3:00 AM, 7:00 AM, 11:00 AM, 1:00 PM, 7:00 PM, and 1:00 AM. The default value is set to 3:00 <nowiki>+</nowiki>4:00, 13:00 <nowiki>+</nowiki>6:00. | *Shifts,Growing—A time profile named Shifts resets statistics to zero when shifts change at 3:00 AM, 7:00 AM, 11:00 AM, 1:00 PM, 7:00 PM, and 1:00 AM. The default value is set to 3:00 <nowiki>+</nowiki>4:00, 13:00 <nowiki>+</nowiki>6:00. | ||
| − | |||
|Status=No | |Status=No | ||
}}{{Section | }}{{Section | ||
|sectionHeading=Time Range | |sectionHeading=Time Range | ||
| − | |||
|alignment=Horizontal | |alignment=Horizontal | ||
|Media=Image | |Media=Image | ||
|image=Pulse_85105_StatOptions3.png | |image=Pulse_85105_StatOptions3.png | ||
| + | |AltText=From the Configuration menu, navigate to Stat Server Properties, then Application Options, to find the list of Time Ranges. | ||
|structuredtext=The Time Range specifies when to collect data for a limited set of statistics. | |structuredtext=The Time Range specifies when to collect data for a limited set of statistics. | ||
| Line 310: | Line 266: | ||
In this example, a Pulse statistic that calculates the total number of calls is based on the time range "Range0-30". If one call is answered after being in a queue for 25 seconds, a second call after 40 seconds, and a third call after 10 seconds, Stat Server counts only the first and third calls. | In this example, a Pulse statistic that calculates the total number of calls is based on the time range "Range0-30". If one call is answered after being in a queue for 25 seconds, a second call after 40 seconds, and a third call after 10 seconds, Stat Server counts only the first and third calls. | ||
| − | |||
|Status=No | |Status=No | ||
}}{{Section | }}{{Section | ||
| Line 316: | Line 271: | ||
|anchor=NextSteps | |anchor=NextSteps | ||
|alignment=Vertical | |alignment=Vertical | ||
| − | |||
| − | |||
|structuredtext=You might want to learn more about: | |structuredtext=You might want to learn more about: | ||
| Line 323: | Line 276: | ||
*{{Link-SomewhereInThisManual|topic=RTRFormulas|anchor=top|display text=Report formulas}} | *{{Link-SomewhereInThisManual|topic=RTRFormulas|anchor=top|display text=Report formulas}} | ||
*{{Link-SomewhereInThisManual|topic=RTRFunctions|anchor=top|display text=Template function library}} | *{{Link-SomewhereInThisManual|topic=RTRFunctions|anchor=top|display text=Template function library}} | ||
| − | |||
| − | |||
|Status=No | |Status=No | ||
}} | }} | ||
}} | }} | ||
Latest revision as of 13:06, August 17, 2021
Contents
Properties of statistics that you can use in your templates and reports.
When you select a statistic within the template wizard, Genesys Pulse displays the values of the statistic properties that are described below.
Alias
The Alias must be a unique name that represents the technical name of the statistic. Use an ASCII letter for the first character.
Display Alias
The Display Alias is the name displayed on the report.
Description
The Description provides the functional meaning of the statistic.
Display Format
The Display Format specifies whether values are shown as time or numbers, and, if numbers, the number of decimal places. Depending on the statistic you chose, the available formats in the drop-down list are time-based or numerical.
List of Values: Time, Integer, Number, Percent, String, Status
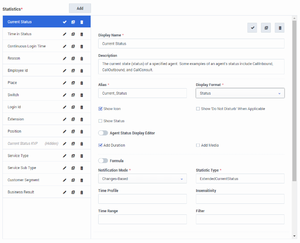
Starting with release 9.0.0, new Status display format is available for statistic with Statistic Type = ExtendedCurrentStatus. The Status display format allows to select the current agent status properties that you want to display:
- Show Status
- Show Icon
- Add Duration
- Add Media
- Show 'Do Not Disturb' when applicableAgent Status Display Options
Starting with release 9.0.001, the Advanced Display Options Editor is available for the Status display format. It allows to fully replace the standard representation with a user-designed representation based on the JavaScript string literals syntax.
The following variables can be used to construct the status to display:
- ${status}–status name
- ${media}–media name
- ${duration}–duration of the current status in the time format (hh:mm:ss)
- ${dnd}–duration of the "Do Not Disturb" status in the time format (hh:mm:ss). The Show "Do Not Disturb" When Applicable checkbox must be selected to display the Do Not Disturb status and duration even if the ${dnd} variable is defined in the custom format via the Editor.
When the ${media} or ${dnd} value is unavailable, it is displayed as Undefined. To avoid this, you can specify conditions and use ternary operators.
Examples:
| Display Format | Displayed data example |
|---|---|
| ${media && !dnd ? media + " {{!}}{{!}} ": ""}${status}(${duration})
(standard format representation when all Status properties are checked) |
voice {{!}}{{!}} WaitForNextCall(00:23:12) or |
| ${duration + " in " + status}${media ? "(" + media+ ")" : ""} | 00:23:12 in WaitForNextCall(voice) or |
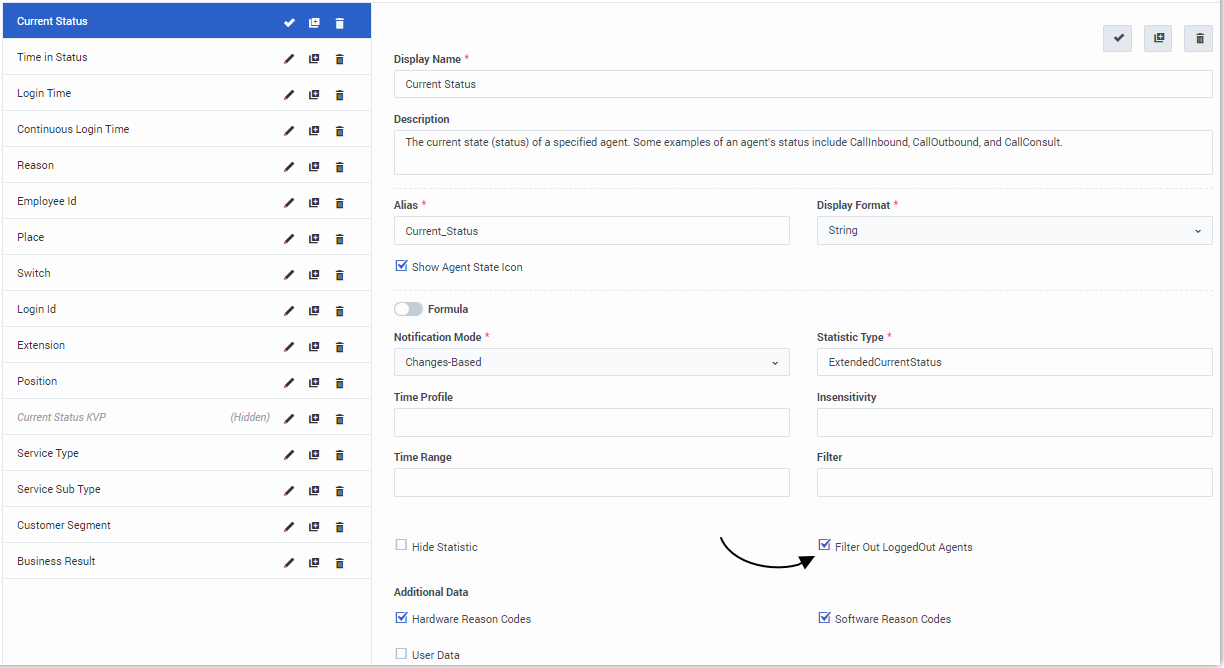
Filter Out LoggedOut Agents
Filters
The Filters represent statistical filters that define restrictive conditions on actions used while calculating the statistic.
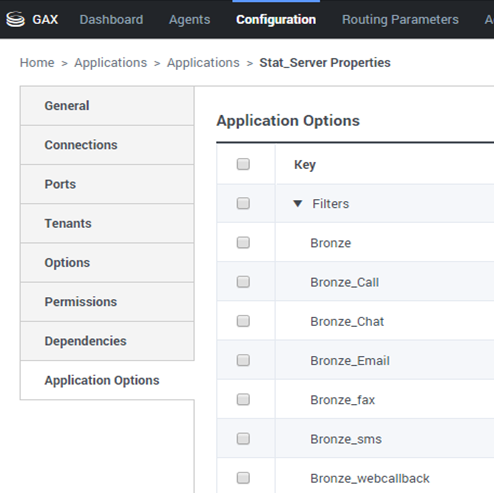
The list of Filters is available in the Configuration section of Genesys Administrator Extension (GAX). This view is available in Stat Server application options used by Genesys Pulse.
Your account must have privileges to access this section.
Within GAX, you can add, edit or delete a filter.Filters Example
Suppose that you want to filter calls based on language: If the enterprise set up the key Language to identify language and the value Spanish for callers who speak Spanish, you could use the PairExists UserData function to search for calls with attached data in the Language/Spanish key-value pair.
On the Options tab of the Stat Server Properties screen, you could add a SpanishLanguage option in the [Filters] section and specify filtering for calls with attached data containing the key "Language" and the value "Spanish".
The example would have SpanishLanguage in the Name field and PairExists("Language","Spanish") in the Value field.
Now, when an agent attaches the "Spanish/Language" key-value pair to calls from a desktop application, the calls are filtered out of statistical calculations.
Formula
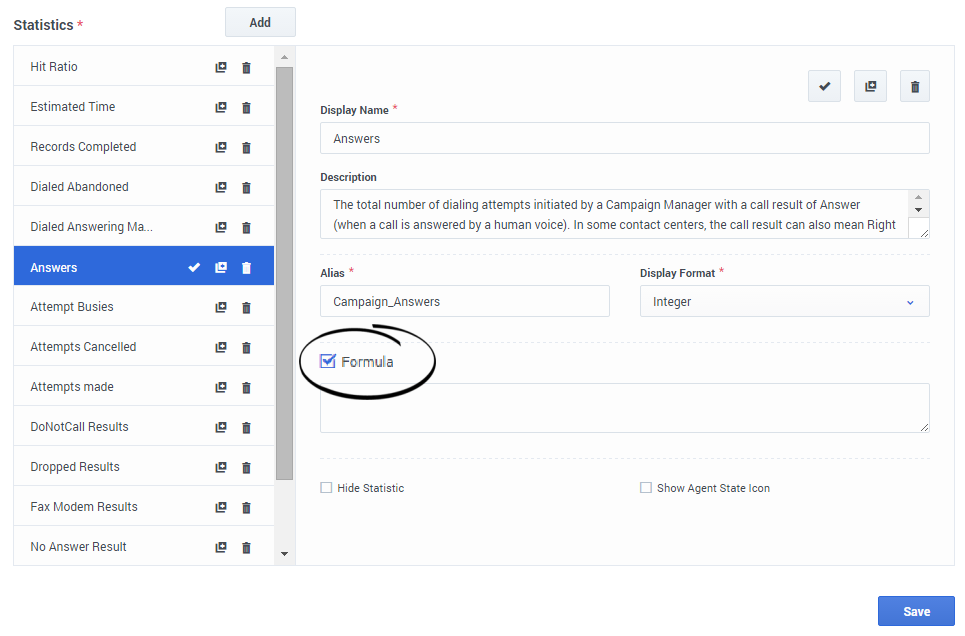
From the statistic detail pane, you can create or customize statistics by creating a formula.
The formula uses a javascript-based syntax, which lets you calculate expressions with values given by other statistic and use functions provided by Genesys for more specific calculations. For example, you can calculate the ratio of the calls abandoned to the calls offered in your queue to measure the percentage of abandoned calls in your queue.
Genesys Pulse assumes the offered calls are defined by a statistic alias Offered and the abandoned calls are defined by a statistic alias Abandoned.The formula must return a Result value to be valid and can access any statistics of the template with the following syntax: Data.<Statistic-Alias>.Value
All formulas must contain an assignment for the Result variable (for example, Result=). The Result of the formula calculation is the final value of this variable.
For example, here is a formula using the function G.GetAgentNonVoiceStatus():
Result = G.GetAgentNonVoiceStatus(Data.Current_Status.Value, email);GroupBy
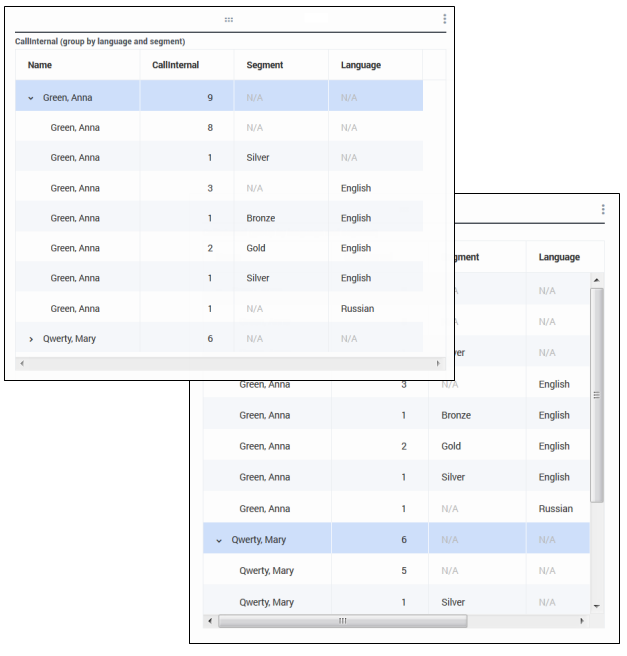
The GroupByColumns option facilitates provisioning of Pulse widgets and enable multi-dimensional data presentation (GroupBy capability) in Grid widgets and in the Data view on an expanded widget tab.
GroupBy columns should contain valid unique aliases, separated by comma.
StatType, used with GroupBy capability, must define the following additional attributes:
- GroupBy—contains grouping expressions separated by comma
- GroupByColumns—contains aliases for grouping expressions separated by comma
Example:
To monitor the number of internal calls grouped by Language and Segment, instead of explicitly defined and applied filters to a metric, define the GroupBy and GroupByColumns for the StatType in the Stat Server:
[Total_Calls_Grouped]
Category=TotalNumber
GroupBy=GetString(UserData,"Language"), GetString(UserData,"Segment")
GroupByColumns=Language, Segment
MainMask=CallInternal
Objects=Agent
Subject=DNAction
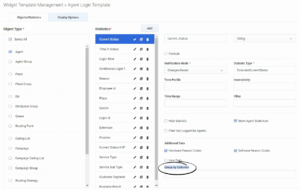
Include a metric based on this StatType in your widget template and make sure Group By Columns field is filled correctly with “Language, Segment” string.
- All metrics in the StatType GroupByColumns attribute aliases must be included in the Group by Columns field or all GroupBy data is ignored.
- GroupBy support relies on StatServer functionality that was introduced in release 8.5.103.
- Pulse supports snapshots when GroupBy is applied to the same expression for either all or no statistics.
- When you use a GroupBy expression that involves user data which is changed during call, that call will be counted in the group with the old value (or no value) AND in the group with new value. Therefore, for the TotalNumber statistics, if you add up all values for all groups, you have more than the statistic's total value.
You can use Group by Columns option when you create a template:
Insensitivity
Insensitivity describes a condition for Stat Server to send updates of statistical values to its clients. An increase in the value of this parameter usually decreases network traffic, but it also reduces reporting accuracy, because values are not updated as frequently. This setting is not visible in Stat Server configuration, but rather, clients pass its value to Stat Server along with each statistic request.
Insensitivity plays no role for reset-based statistics. For time-based or change-based notification mode, Stat Server only reports the recalculated value if the absolute value of the difference between the previous value and the recalculated value or its percentage ratio to the recalculated value is at least equal to the number specified by Insensitivity.
For example, if the result has a long integer data type—as is the case for statistics measuring time—Stat Server uses the absolute difference in values for comparison. Given an Insensitivity setting of 5 in this case, Stat Server sends the recalculated result to its client when the absolute value of the difference between the new and old result is at least 5 (seconds, usually).
Notification Mode
The Notification Mode determines when Stat Server sends updated statistical values. These are the valid options:
- Time-Based—Select this Notification Mode to instruct Stat Server to recalculate the statistic by the frequency displayed in Notification Frequency property. Stat Server sends a new value to Genesys Pulse only when the absolute difference from the last reported value exceeds the Insensitivity property.
- Change-Based—Select this Notification Mode to instruct Stat Server to notify Genesys Pulse about changes immediately.
- No Notification—Select this option to instruct Stat Server to not report updates. Updates are turned off in this case.
- Reset-Based—Select this Notification Mode to instruct Stat Server to report Genesys Pulse value right before setting it to zero (0). CurrentState statistics cannot be requested with Reset-Based notification mode.
Notification Frequency
Use Notification Frequency to set how often, in seconds, Stat Server recalculates the statistic and notifies Genesys Pulse if the statistic changes by more than the valued displayed in the Insensitivity field. This field is only used when a Time-Based Notification Mode is selected for the statistic.
Statistic Type
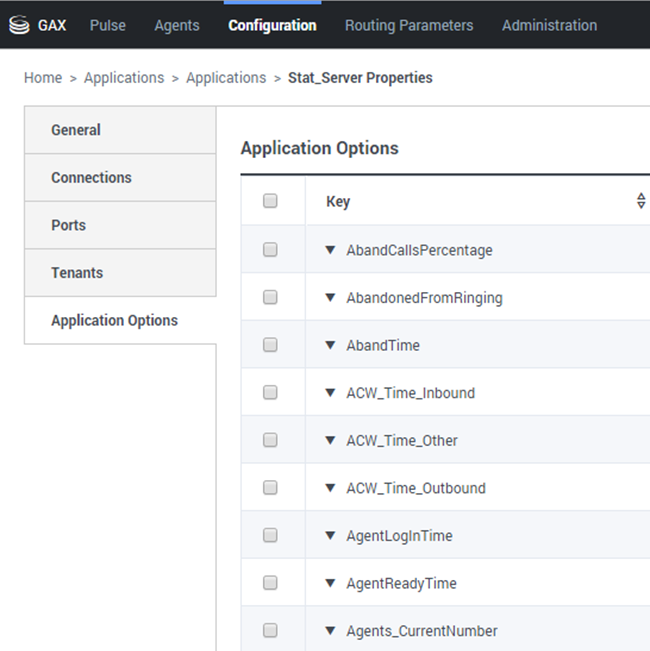
The mandatory Statistic Type displays the parameters that define the statistic type within Stat Server.
The list of Statistic Types available in the environment should be accessible through GAX within the Configuration section. You can view them in the Application Options of the Stat Server application used by Genesys Pulse.
Your account must have privileges to access the Configuration section.
Within GAX, you can add, edit, or delete a statistic type.
This list should be the same as the list of statistic types detailed in the Genesys Pulse templates spreadsheet.Time Profile
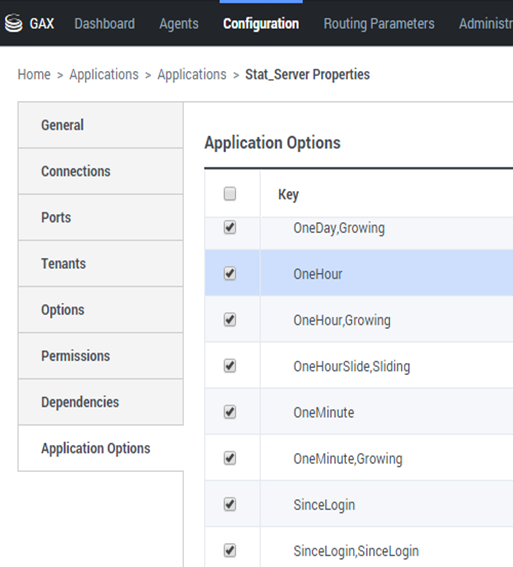
Use the Time Profile to define the Time Profile for the statistic and specify the interval over which historical aggregate values are calculated. All time profiles are defined as configuration options in the Time Profiles of the Stat Server Application object in Genesys Configuration.
The list of Time Profiles available in the environment should be accessible in the GAX Configuration section. This view is available in Stat Server application options used by Genesys Pulse.
Your account must have privileges to access this section.
Within GAX, you can add, edit, or delete a Time Profile.
The Time Profile contains four main types:
- Growing
- Sliding
- Selection
- SinceLogin
Time Profiles Examples
- Default,Growing—The Default time profile uses a Growing interval type and resets statistics to zero (0) every night at midnight. The default value is set to 00:00.
- LastHour,Sliding—The LastHour time profile uses a Sliding interval type and tracks the last hour of activity with a sampling taken every 15 seconds. The default value is set to 3600:15.
- SinceLogin,SinceLogin—SinceLogin resets statistics to zero (0) at the moment of agent login. Statistics continue to accumulate as long as the agent is logged into (any) DN. The SinceLogin interval type aggregates statistical data only for agent-object statistics.
- Shifts,Growing—A time profile named Shifts resets statistics to zero when shifts change at 3:00 AM, 7:00 AM, 11:00 AM, 1:00 PM, 7:00 PM, and 1:00 AM. The default value is set to 3:00 +4:00, 13:00 +6:00.
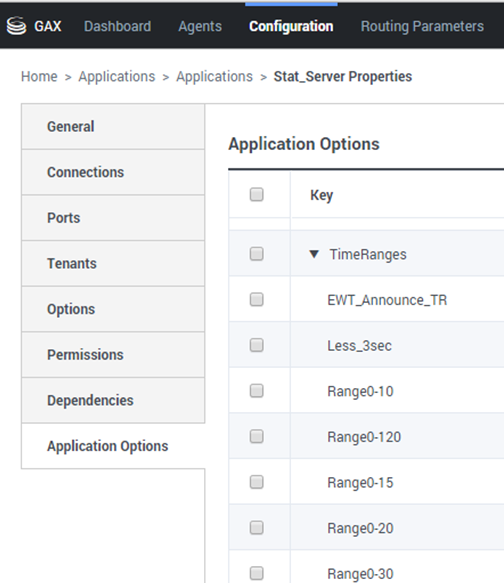
Time Range
The Time Range specifies when to collect data for a limited set of statistics.
The list of Time Ranges is available in the Configuration section of GAX. This view is available in the options of the Stat Server application used by the Genesys Pulse solution.
Your account needs to have privileges to access this section.
Within GAX, you can add, edit, or delete a time range.
Time Ranges apply to statistics in following categories:
- TotalNumberInTimeRange
- TotalNumberInTimeRangePercentage
- CurrentNumberInTimeRange
- CurrentNumberInTimeRangePercentage
- ServiceFactor1
- TotalTimeInTimeRange
Time Range Example
Suppose that you want to calculate the total number of calls answered within 30 seconds. To do so, enter Range0-30 in the Name field, and 0-30 in the Value field.
In this example, a Pulse statistic that calculates the total number of calls is based on the time range "Range0-30". If one call is answered after being in a queue for 25 seconds, a second call after 40 seconds, and a third call after 10 seconds, Stat Server counts only the first and third calls.
What do I do next?
You might want to learn more about:

