Agent Variance Report
Contents
Success using Genesys Predictive Routing (GPR) depends on the presence of variance in agent performance for a target metric. The more variance between agents, the greater the impact of choosing better agents.
About the Agent Variance Report
The Agent Variance report actually produces two different graph types, depending on your choices as you configure the report:
- Inter-agent Variance - Shows how well individual agents perform, which enables you to see which are your highest-performing and weakest agents.
- Agent Variance - Shows the range of agent performance for each category as specified in the Group By field. For example, if you group your report by location, you can see how your agents are performing in each location.
- Predictive Routing supports report generation that includes up to 250 features (columns).
- For all reports, mandatory fields are marked with an asterisk.
Generate an Agent Variance Report
About the Agent Variance Report Graphs
Inter-Agent Variance
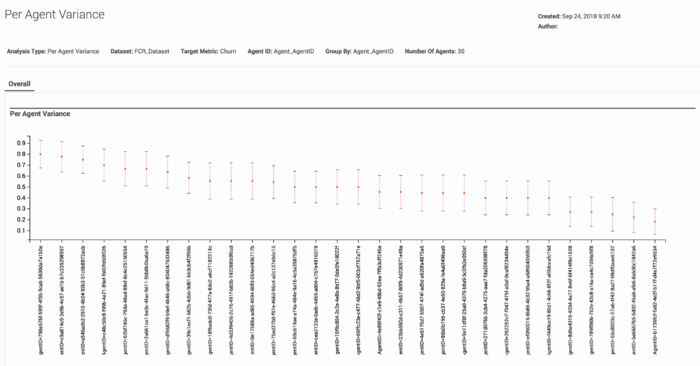
When specify Agent_ID as the value for the Group By setting, the graph shows inter-agent variance with each agent functioning as its own "group". In this scenario, the highest potential for optimization occurs when you have tight vertical bounds, showing consistency in agent skills, and large horizontal variations, indicating that the mean values for these agents are very different.
In the Inter-agent variance graph, each red bar represents one agent.
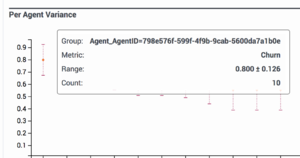
Hover over the center red dot on any bar to view details about that item.
- The Range indicates the numeric value of the mean (central dot), followed by the the standard error of the mean for the agent who is represented by the selected bar, showing agent performance for the specified Metric. The standard error of the mean is "a measure of the dispersion of sample means around the population mean" ( Wikipedia, Standard Error).
- The Count is the number of interactions (or rows in the Dataset) and agent has that relate to the specified Metric.
Agent Variance Across Categories
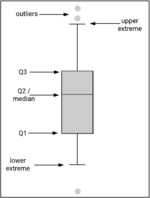
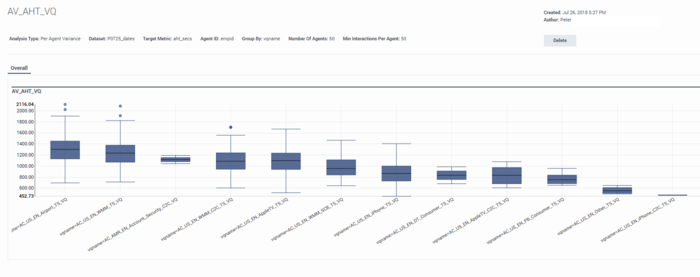
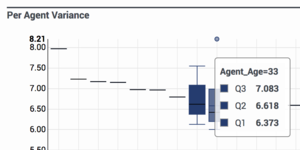
If you select any Group By value other than the agent ID, the result is shown in a box plot.
- A large variation in the mean or median values along the horizontal axis means that the agent performs very differently depending on the selected interaction or customer category (whatever you entered as the Group By value).
- A large variation on the vertical axis means that agent performance varies a great deal within the category.
If you hover over any box on the graph, a popup window shows the numeric values that are shown graphically in the box plot. Gray dots scattered above or below the box plot and its whiskers indicate outlier values.
Q in this window stands for quartile. The numbers on the popup indicate the numeric value at which the respective quartile starts.

