Difference between revisions of "PE-GPR/9.0.0/Help/KPIOutcome"
From Genesys Documentation
(Published) |
(Published) |
||
| (One intermediate revision by one other user not shown) | |||
| Line 3: | Line 3: | ||
|DisplayName=View KPI outcome | |DisplayName=View KPI outcome | ||
|TocName=View KPI outcome | |TocName=View KPI outcome | ||
| − | |Context=View how well GPR optimizes your KPIs compared | + | |Context=View how well Genesys Predictive Routing (GPR) optimizes your key performance indicators (KPIs) compared with routing without GPR. |
|ComingSoon=No | |ComingSoon=No | ||
|Platform=GenesysEngage-cloud | |Platform=GenesysEngage-cloud | ||
| Line 12: | Line 12: | ||
|Media=Image | |Media=Image | ||
|image=GPRKPIOutcome.png | |image=GPRKPIOutcome.png | ||
| − | |structuredtext=The '''KPI Outcome''' tab provides a view into how | + | |structuredtext=The '''KPI Outcome''' tab provides a view into how effectively Predictive Routing (GPR) routing optimizes your KPI compared with non-GPR routing. |
This tab is on the '''Predictors''' window: [[File:GPRPredictorsWindow.png|200 px]] | This tab is on the '''Predictors''' window: [[File:GPRPredictorsWindow.png|200 px]] | ||
|structuredtextwide='''Prerequisites:''' To use this tab, you must have the following: | |structuredtextwide='''Prerequisites:''' To use this tab, you must have the following: | ||
| − | + | *Your account must include an Agent Profile dataset, an interaction dataset with the Interaction ID field set, one or more predictors, and have scoring data available. | |
| − | *Your account must include an Agent Profile dataset, an interaction dataset with the Interaction ID field set, one or more | + | *You must configure Data Loader to extract the necessary data from the Genesys Info Mart database to derive outcome results for the metric in your predictor and append this data to the interaction dataset used to create the selected predictor. |
| − | *You must | ||
===Configure the view=== | ===Configure the view=== | ||
| Line 32: | Line 31: | ||
'''Notes on the data displayed''' | '''Notes on the data displayed''' | ||
| − | * | + | *GPR filters the data used to generate this graph to remove calls identified as anomalies. For example, GPR might discard the following: |
| + | **Calls with an AHT of less than 15 seconds or greater than 2400 seconds. | ||
| + | **Calls with null values for the AHT, EMPLOYEE_ID, or VIRTUAL_QUEUE fields. | ||
| + | *:The actual criteria used for filtering depend on your environment. For details, contact your Genesys representative. | ||
*This page does not display real-time updates. GPR refreshes the data displayed once per day, at 3:00 am UTC. | *This page does not display real-time updates. GPR refreshes the data displayed once per day, at 3:00 am UTC. | ||
|Status=No | |Status=No | ||
| Line 41: | Line 43: | ||
|Media=Image | |Media=Image | ||
|image=KPIOutcomeGraph.png | |image=KPIOutcomeGraph.png | ||
| − | |structuredtext=The KPI outcome graph has two vertical axes, volume of interactions on the left and the KPI values on the right. The horizontal axis shows the dates displayed. The graph uses two sets of bars and lines, one for interactions routed using GPR (orange), one for non-GPR interactions ( | + | |structuredtext=The KPI outcome graph has two vertical axes, volume of interactions on the left side and the KPI values on the right. The horizontal axis shows the dates displayed. The graph uses two sets of bars and lines, one for interactions routed using GPR (orange), one for non-GPR interactions (unavailable). |
|structuredtextwide=*Bars: Show the volume of interactions routed with and without GPR on each day. | |structuredtextwide=*Bars: Show the volume of interactions routed with and without GPR on each day. | ||
*Lines: Show the metric level for GPR and Non-GPR interactions on each day. | *Lines: Show the metric level for GPR and Non-GPR interactions on each day. | ||
| − | To view only GPR or non-GPR interactions, click the radio buttons above the graph to | + | To view only GPR or non-GPR interactions, click the radio buttons above the graph to switch what data the graph displays. |
| − | + | Users with Admin permissions can export KPI Outcome data as a .csv file. To export, click the '''Export to CSV''' button. | |
| + | |||
| + | * The export functionality is not available to users with Reviewer permissions. | ||
|Status=No | |Status=No | ||
}} | }} | ||
}} | }} | ||
Latest revision as of 18:28, February 26, 2021
This topic is part of the manual Genesys Predictive Routing Help for version 9.0.0 of Genesys Predictive Routing.
Read this topic for other versions:
View how well Genesys Predictive Routing (GPR) optimizes your key performance indicators (KPIs) compared with routing without GPR.
Related documentation:
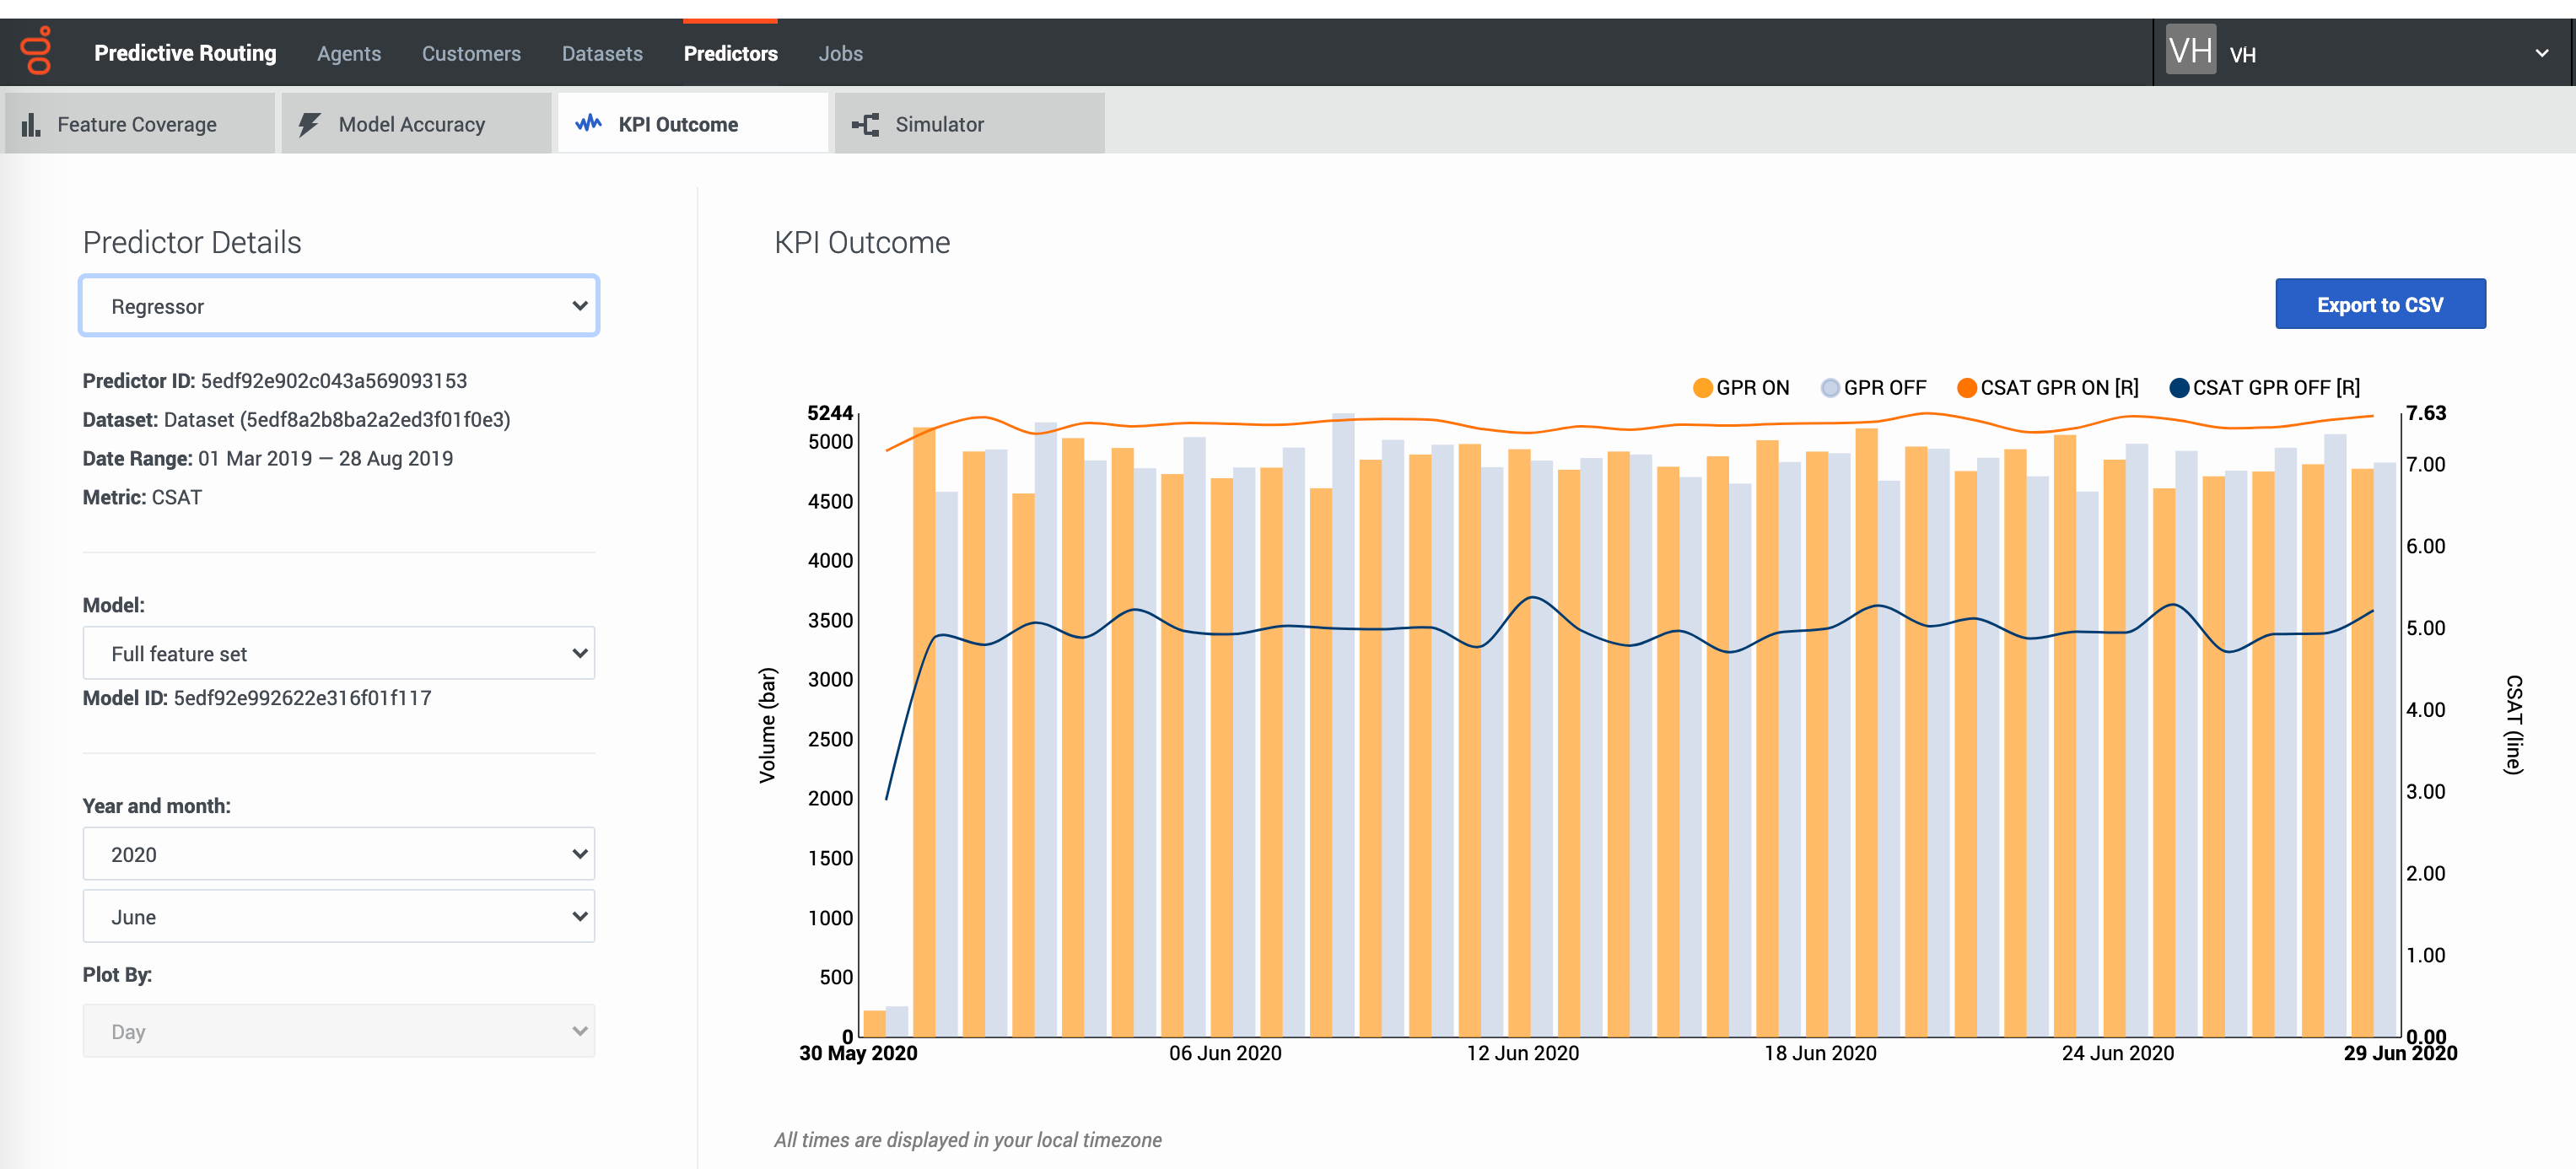
The KPI Outcome tab
The KPI Outcome tab provides a view into how effectively Predictive Routing (GPR) routing optimizes your KPI compared with non-GPR routing.
This tab is on the Predictors window:Prerequisites: To use this tab, you must have the following:
- Your account must include an Agent Profile dataset, an interaction dataset with the Interaction ID field set, one or more predictors, and have scoring data available.
- You must configure Data Loader to extract the necessary data from the Genesys Info Mart database to derive outcome results for the metric in your predictor and append this data to the interaction dataset used to create the selected predictor.
Configure the view
The KPI Outcome tab enables you to select the following information:
- The name and ID of the predictor. Use the selector to specify which predictor to view.
- The name and ID of the model. Use the selector to specify which model to view.
- The displayed date range. Use the year and month selectors to specify the month to view.
The Plot By granularity is set to Day. This value is not configurable.
Notes on the data displayed
- GPR filters the data used to generate this graph to remove calls identified as anomalies. For example, GPR might discard the following:
- Calls with an AHT of less than 15 seconds or greater than 2400 seconds.
- Calls with null values for the AHT, EMPLOYEE_ID, or VIRTUAL_QUEUE fields.
- The actual criteria used for filtering depend on your environment. For details, contact your Genesys representative.
- This page does not display real-time updates. GPR refreshes the data displayed once per day, at 3:00 am UTC.
Read and configure the graph
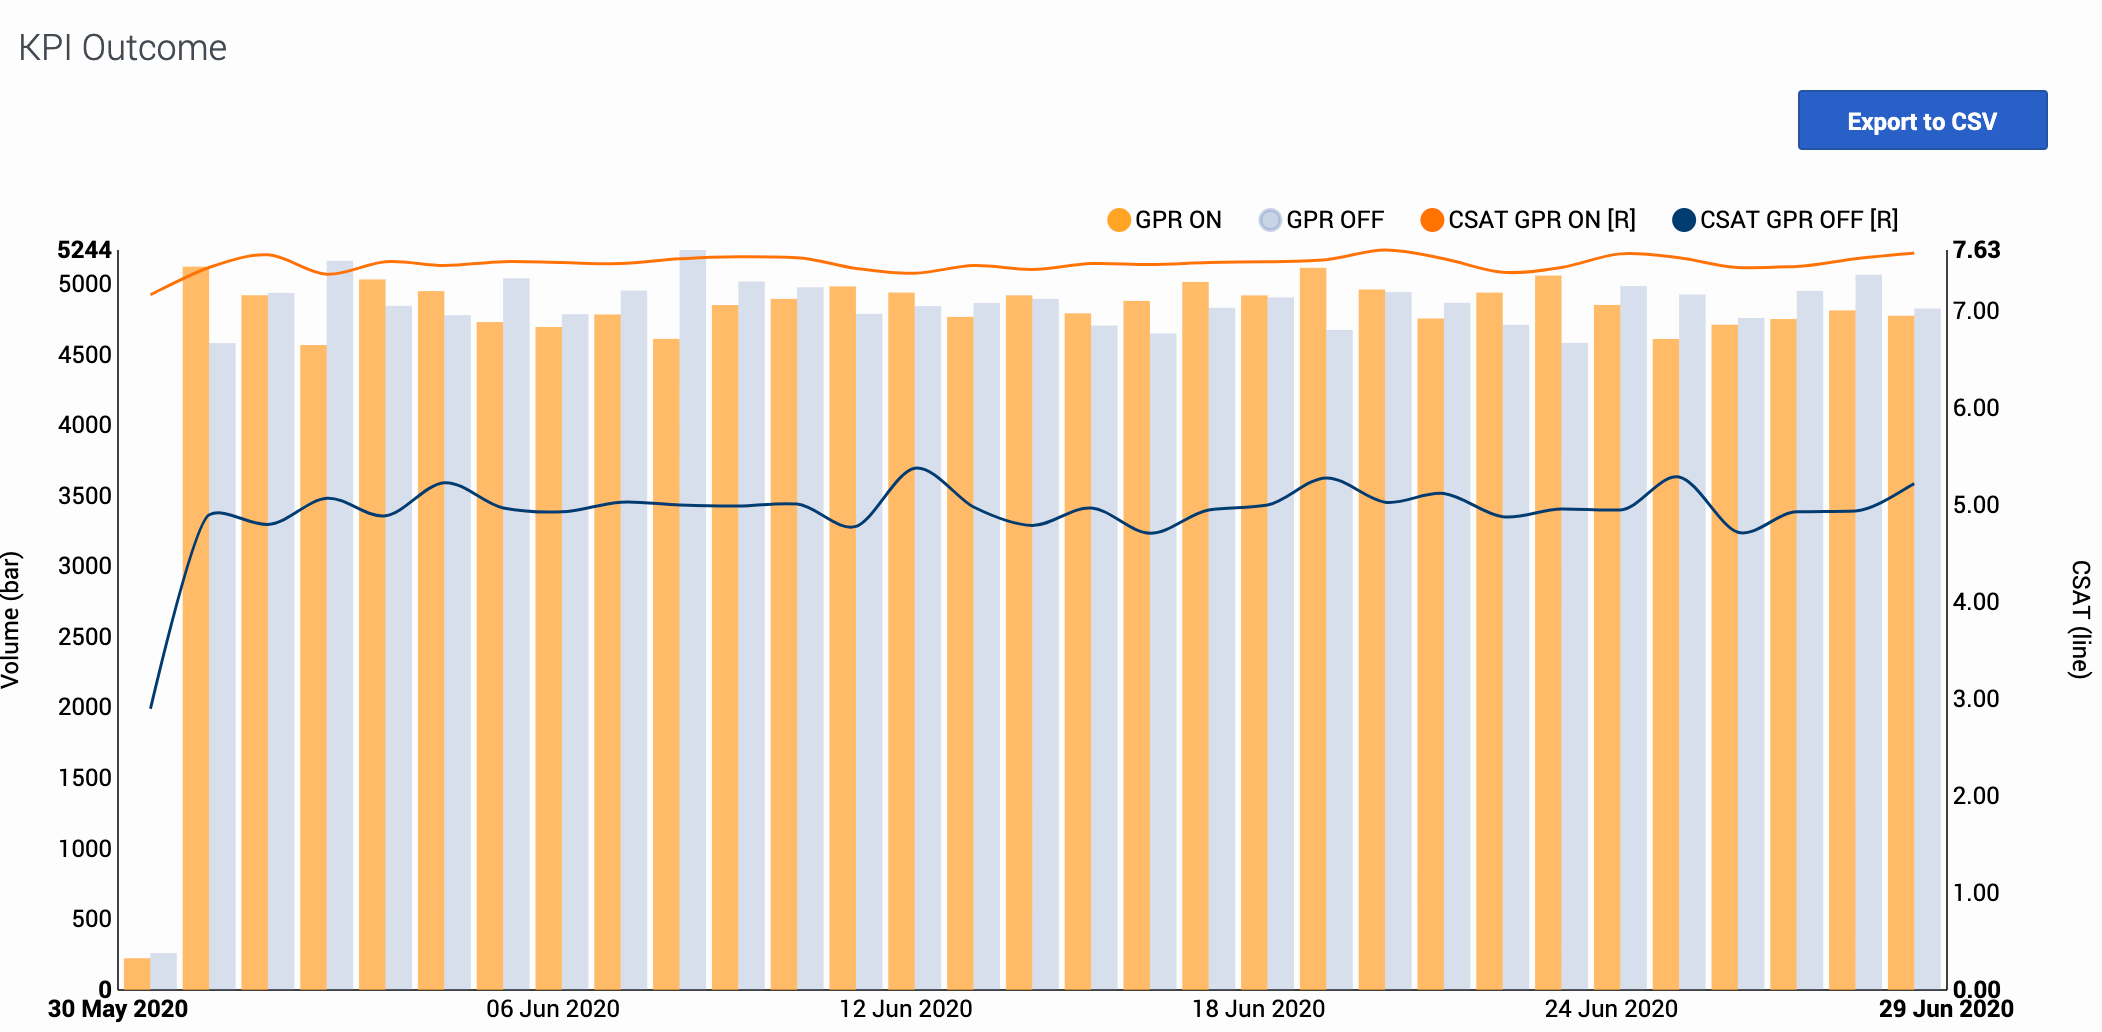
The KPI outcome graph has two vertical axes, volume of interactions on the left side and the KPI values on the right. The horizontal axis shows the dates displayed. The graph uses two sets of bars and lines, one for interactions routed using GPR (orange), one for non-GPR interactions (unavailable).
- Bars: Show the volume of interactions routed with and without GPR on each day.
- Lines: Show the metric level for GPR and Non-GPR interactions on each day.
To view only GPR or non-GPR interactions, click the radio buttons above the graph to switch what data the graph displays.
Users with Admin permissions can export KPI Outcome data as a .csv file. To export, click the Export to CSV button.
- The export functionality is not available to users with Reviewer permissions.
Comments or questions about this documentation? Contact us for support!


