Genesys Portal metrics
Contents
Learn about the metrics details of Genesys Portal for internal monitoring.
Metrics details of Genesys Portal (for internal use only)
Since Genesys Portal is a static page that does not have a backend, the details of the metrics are not exposed. Genesys uses Push-Gateway, which an intermediary service that allows you to push metrics from jobs that cannot be scrapped.
The internal job checks the HTTP status code of Genesys Portal in each tenant and exposes the HTTP status code to the push gateway page in the 9091 port and /metrics path.
Prometheus/Grafana Cloud scrapes the metrics values from the above-mentioned path.
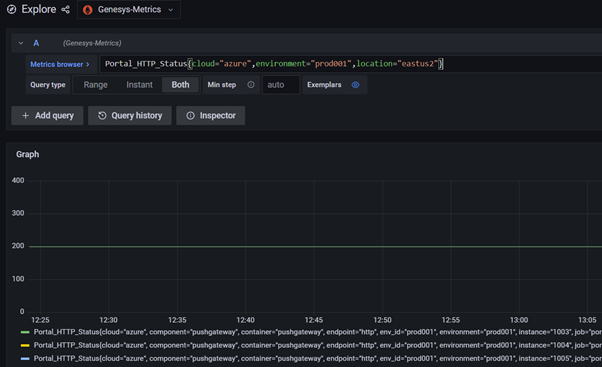
Metric name: Portal_HTTP_Status
Description: Checks and exposes the HTTP status code of the Genesys Portal page.
Genesys Portal metric exploration
The following screenshot illustrates the Genesys Portal metric exploration in Grafana Cloud.
Portal dashboard
The following screenshot illustrates Portal dashboard in Grafana Cloud
Here is the Grafana Cloud dashboard link: Portal Status Dashboard
Metrics for alerts
If the portal HTTP status code is not 200 for 10 minutes for a tenant, the PagerDuty incident is triggered automatically. The following screenshot illustrates the alert metrics:


