Sample Prometheus queries
From Genesys Documentation
This topic is part of the manual Work with Genesys CX Insights Reports for version Current of Reporting.
Sample Prometheus queries to collect metrics.
Related documentation:
RSS:
Here are some sample Prometheus queries to collect metrics. The result of each query in Prometheus can either be shown as a graph or viewed as console output.
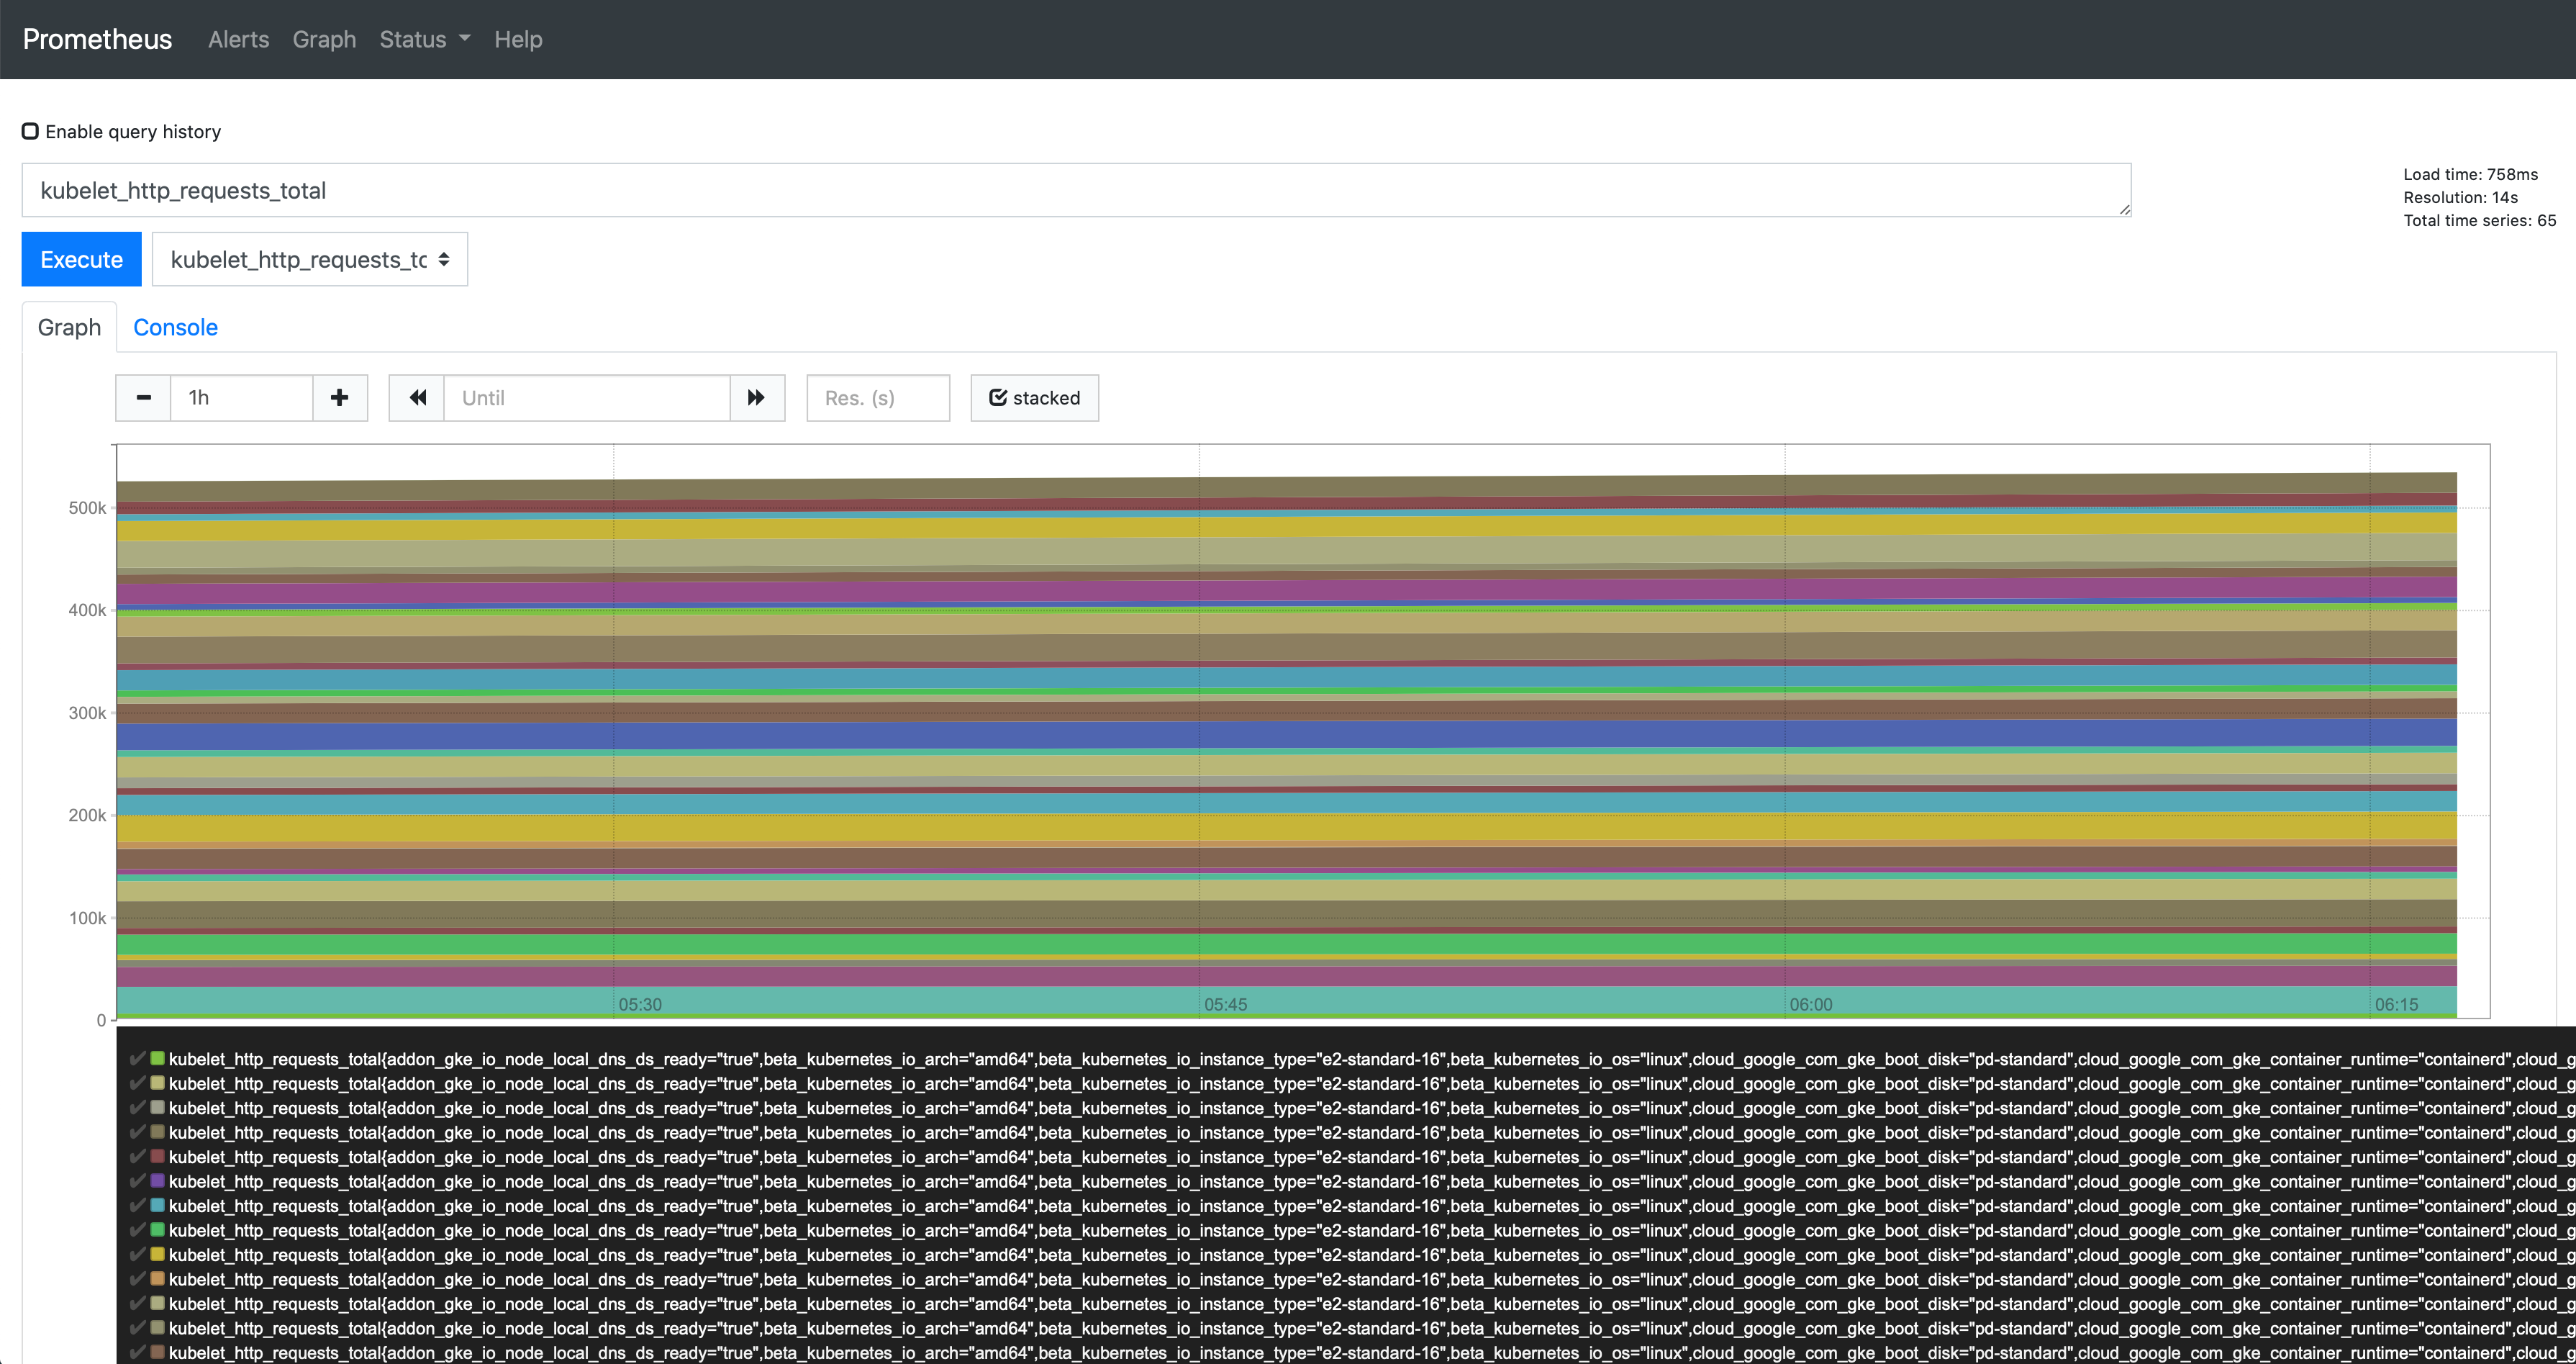
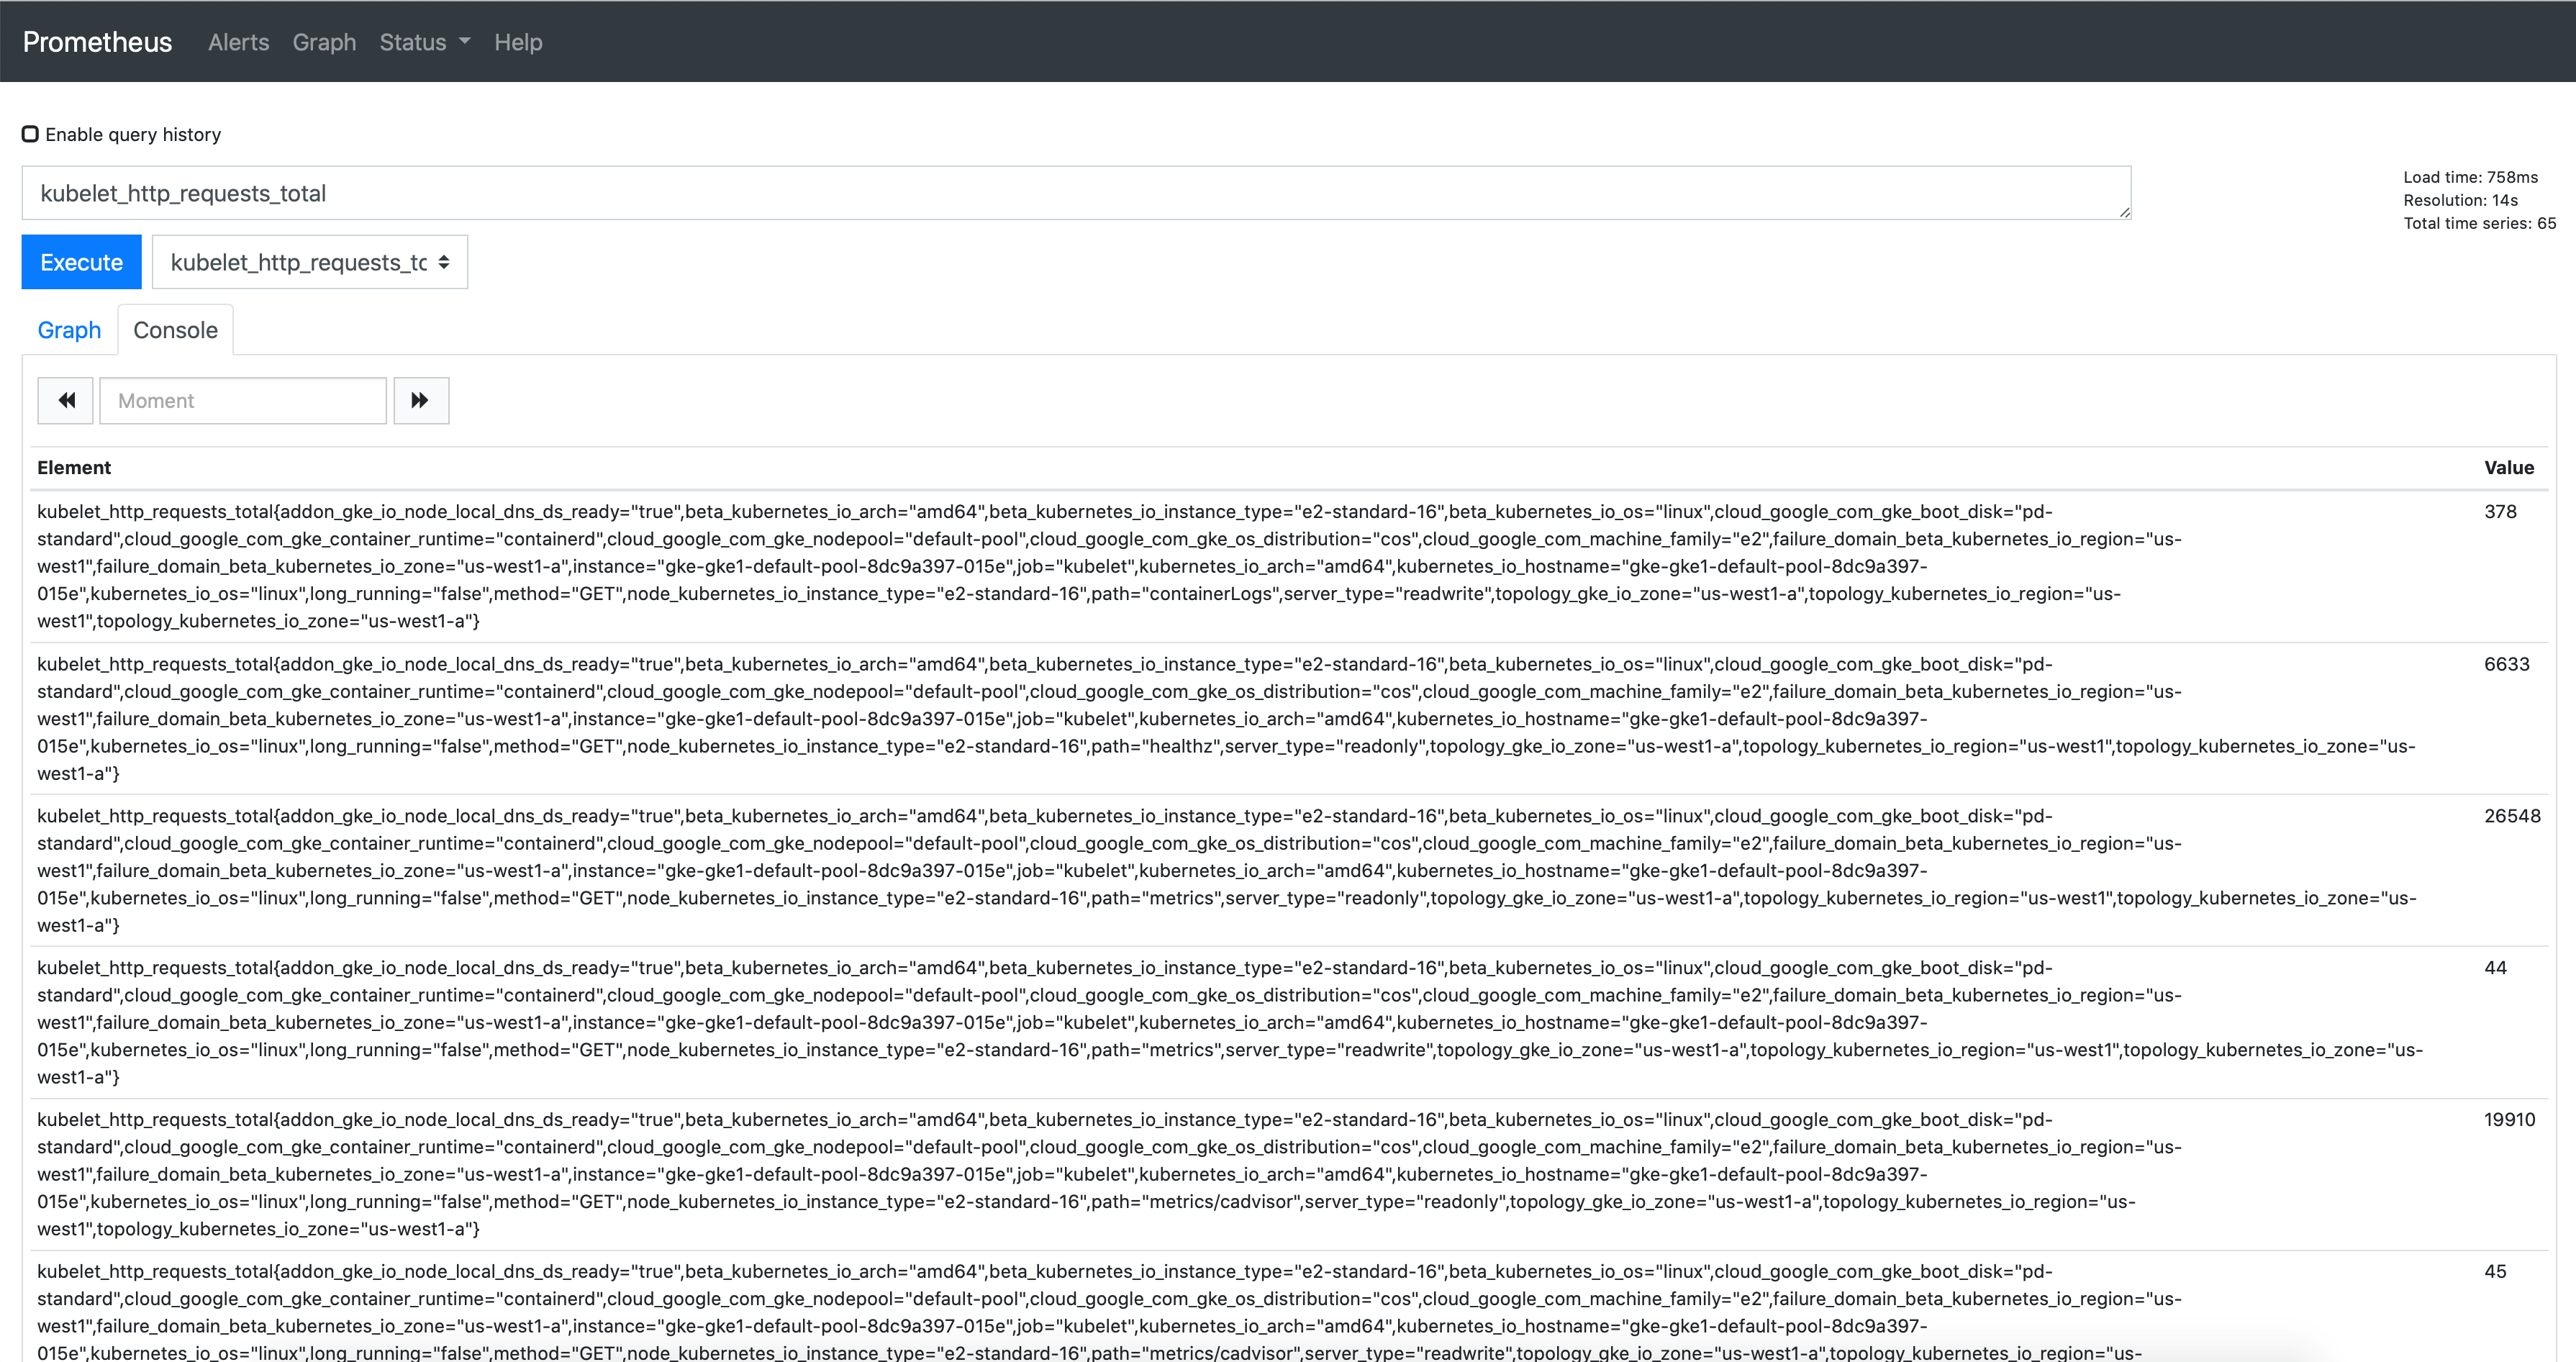
Query1: kubelet_http_requests_total
Output:
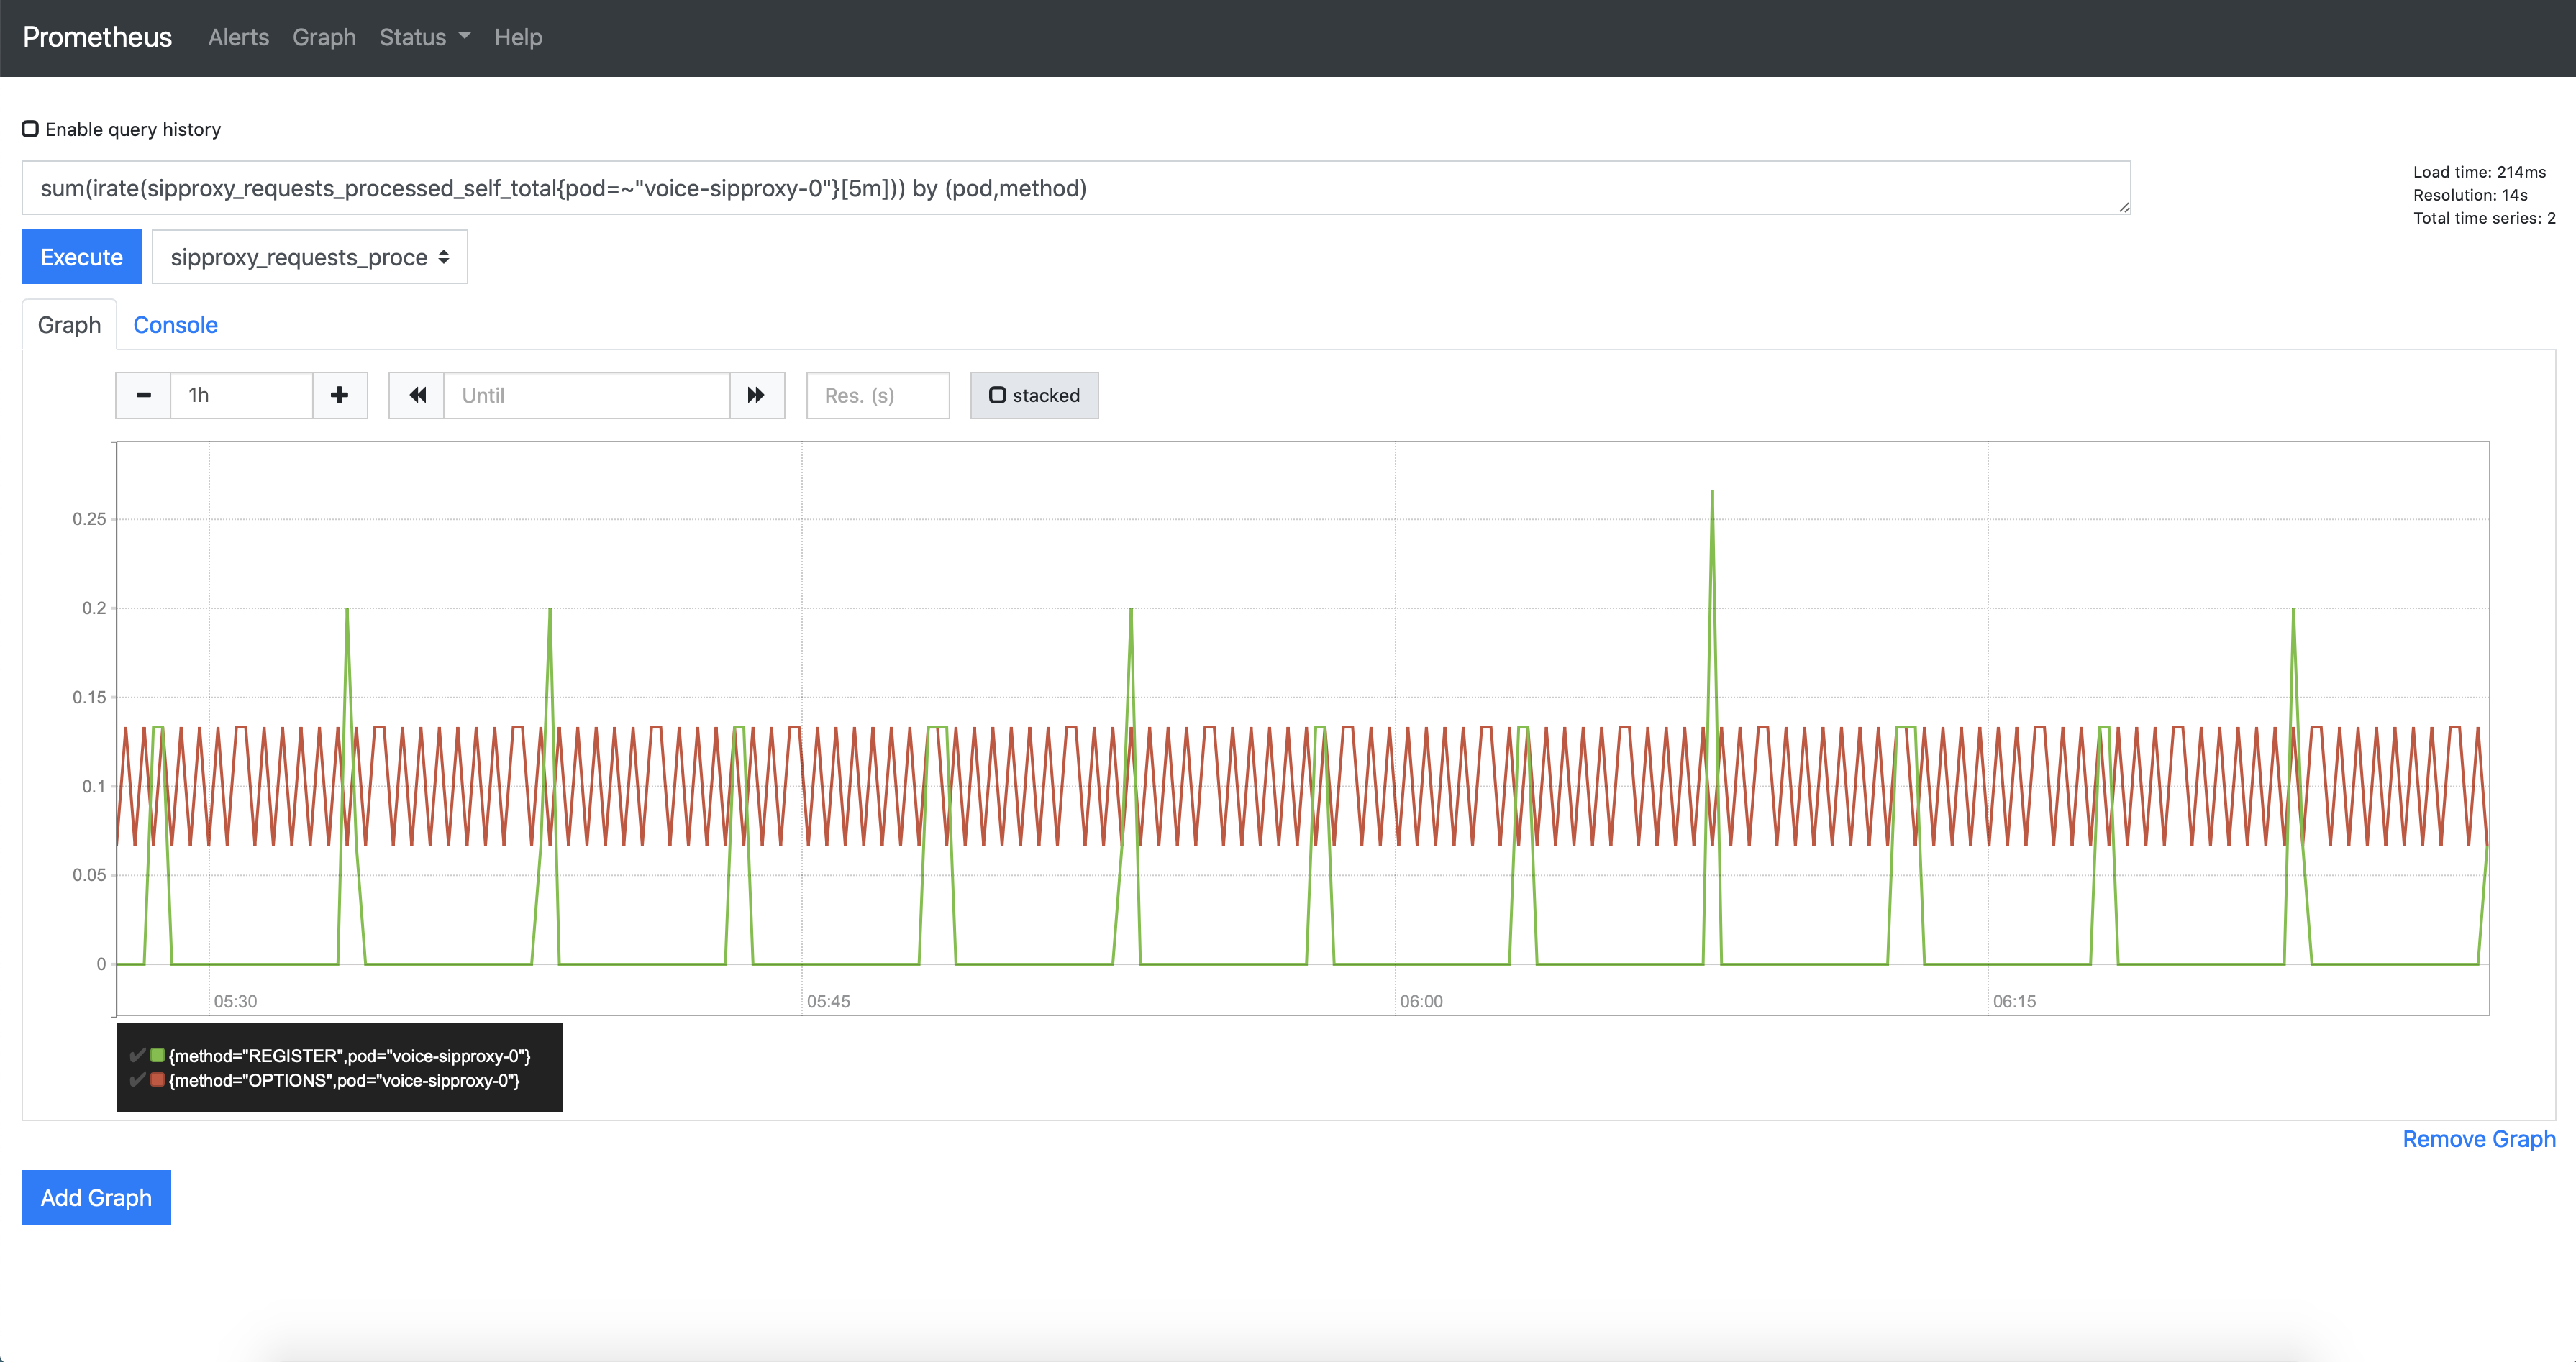
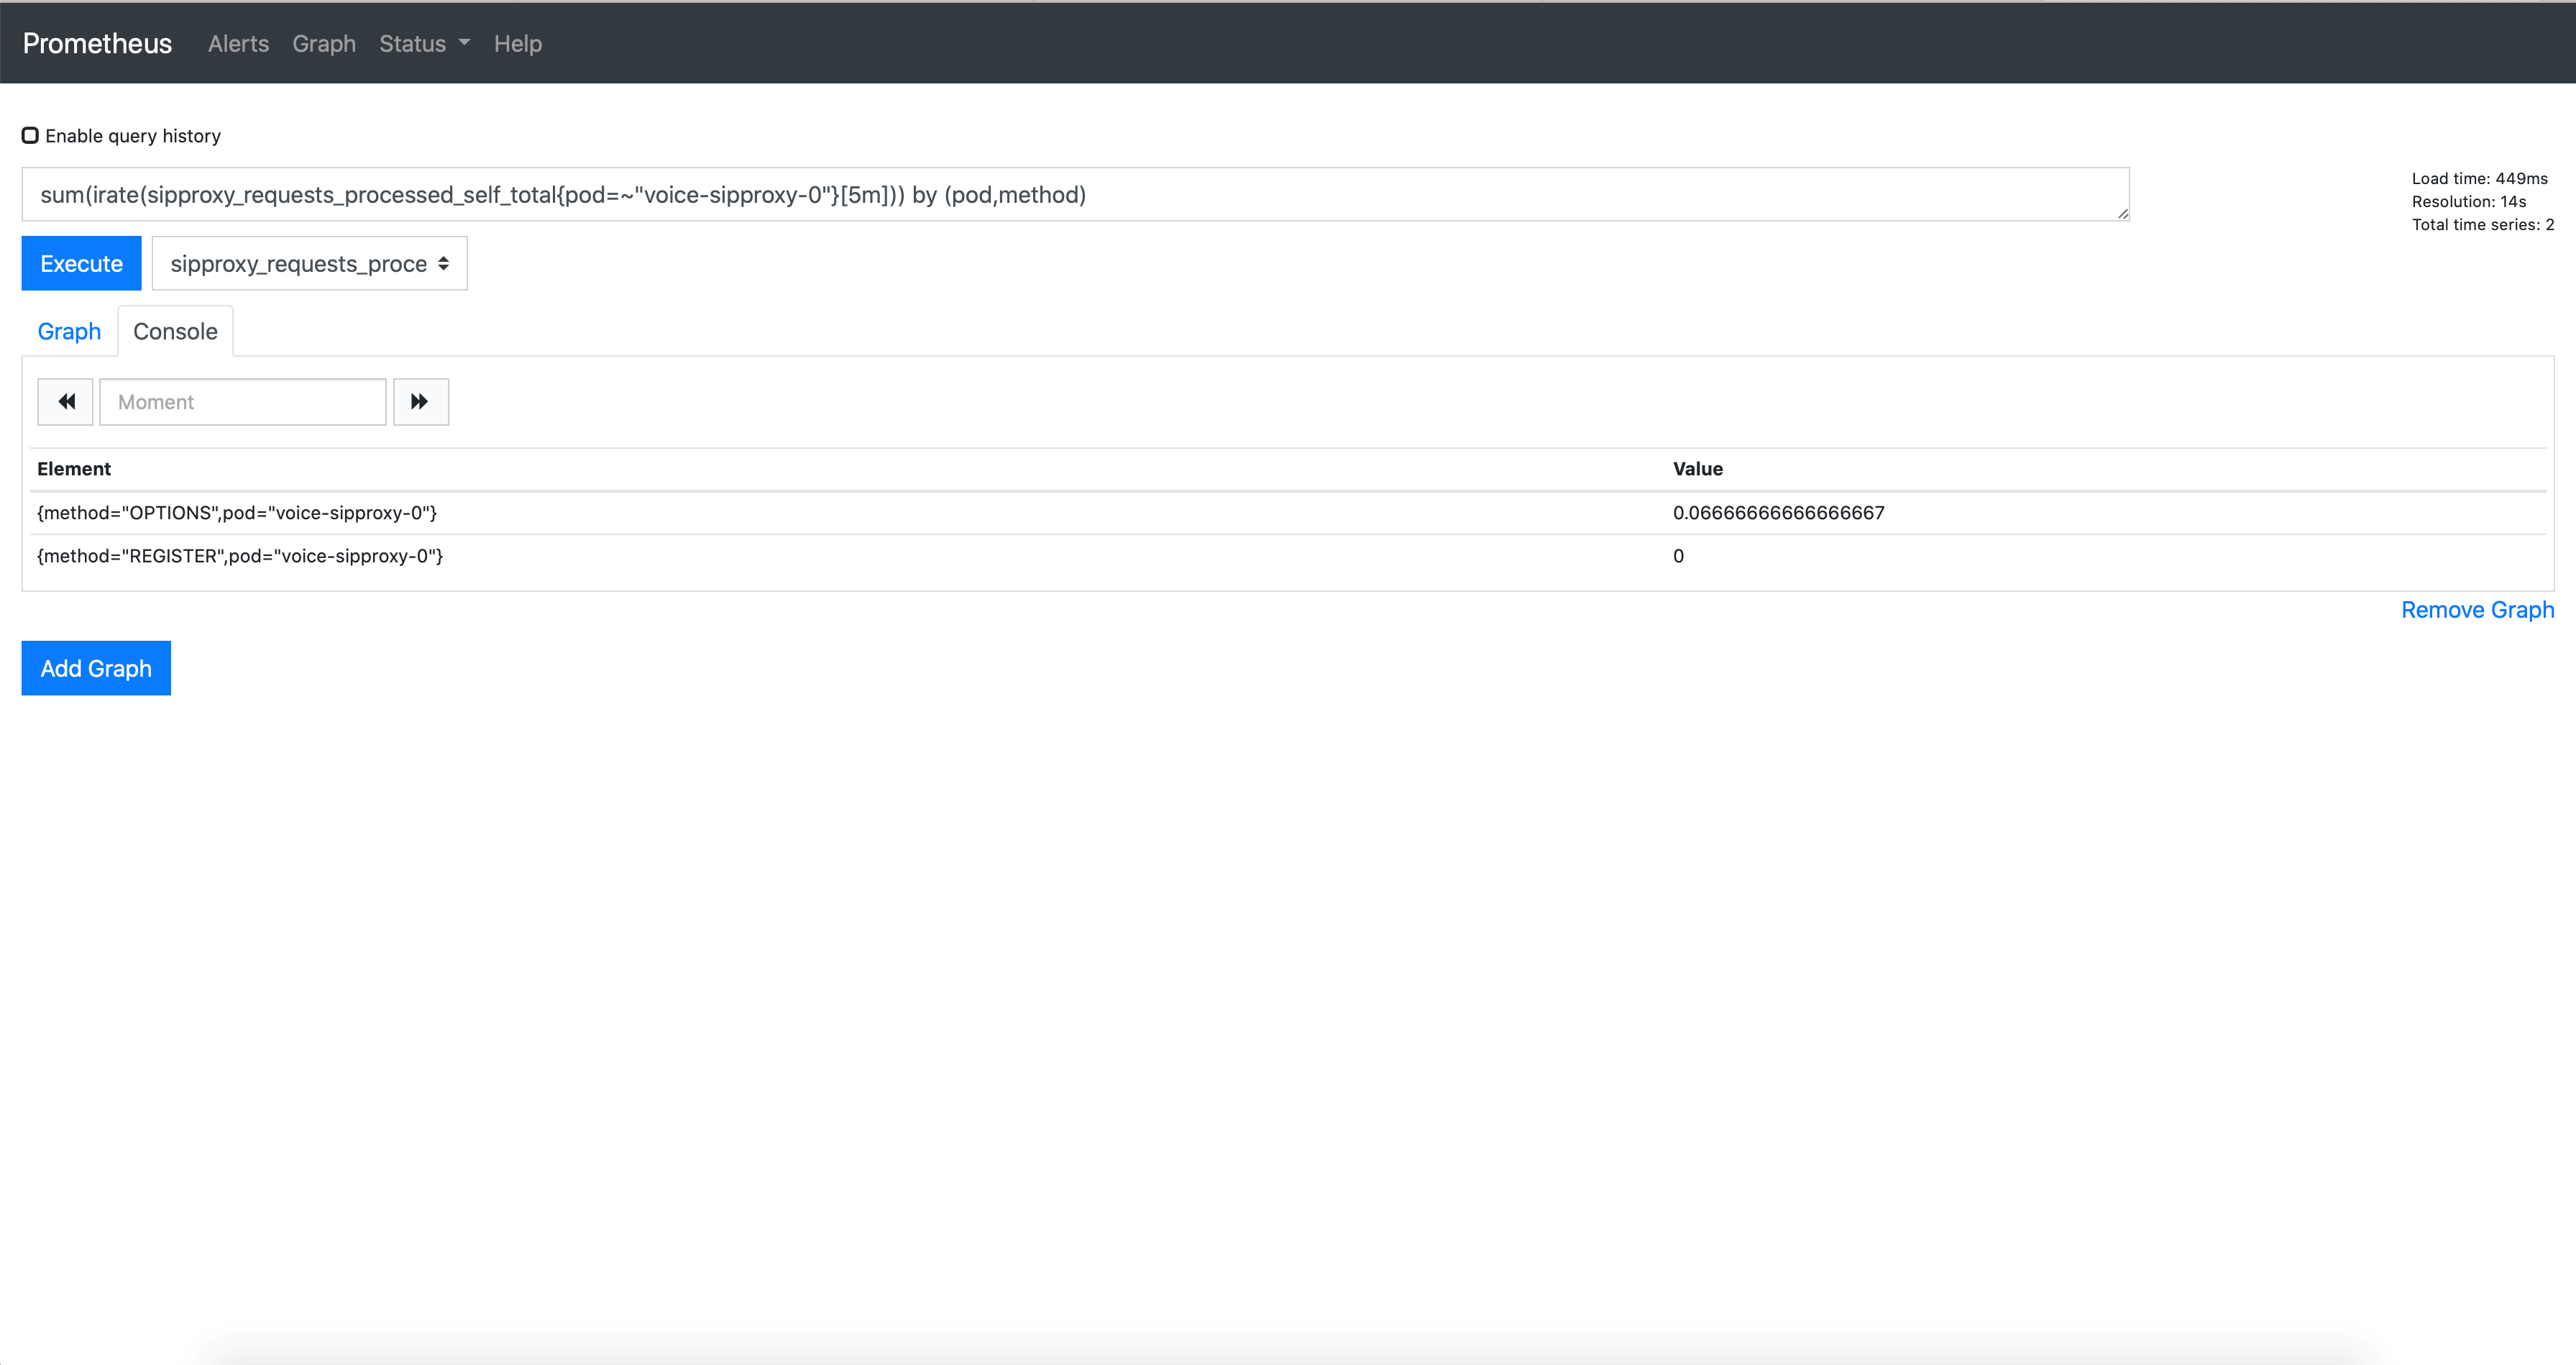
Query 2: sum(irate(sipproxy_requests_processed_self_total{pod=~"voice-sipproxy-0"}[5m])) by (pod,method)
Output
Graph:
Console:
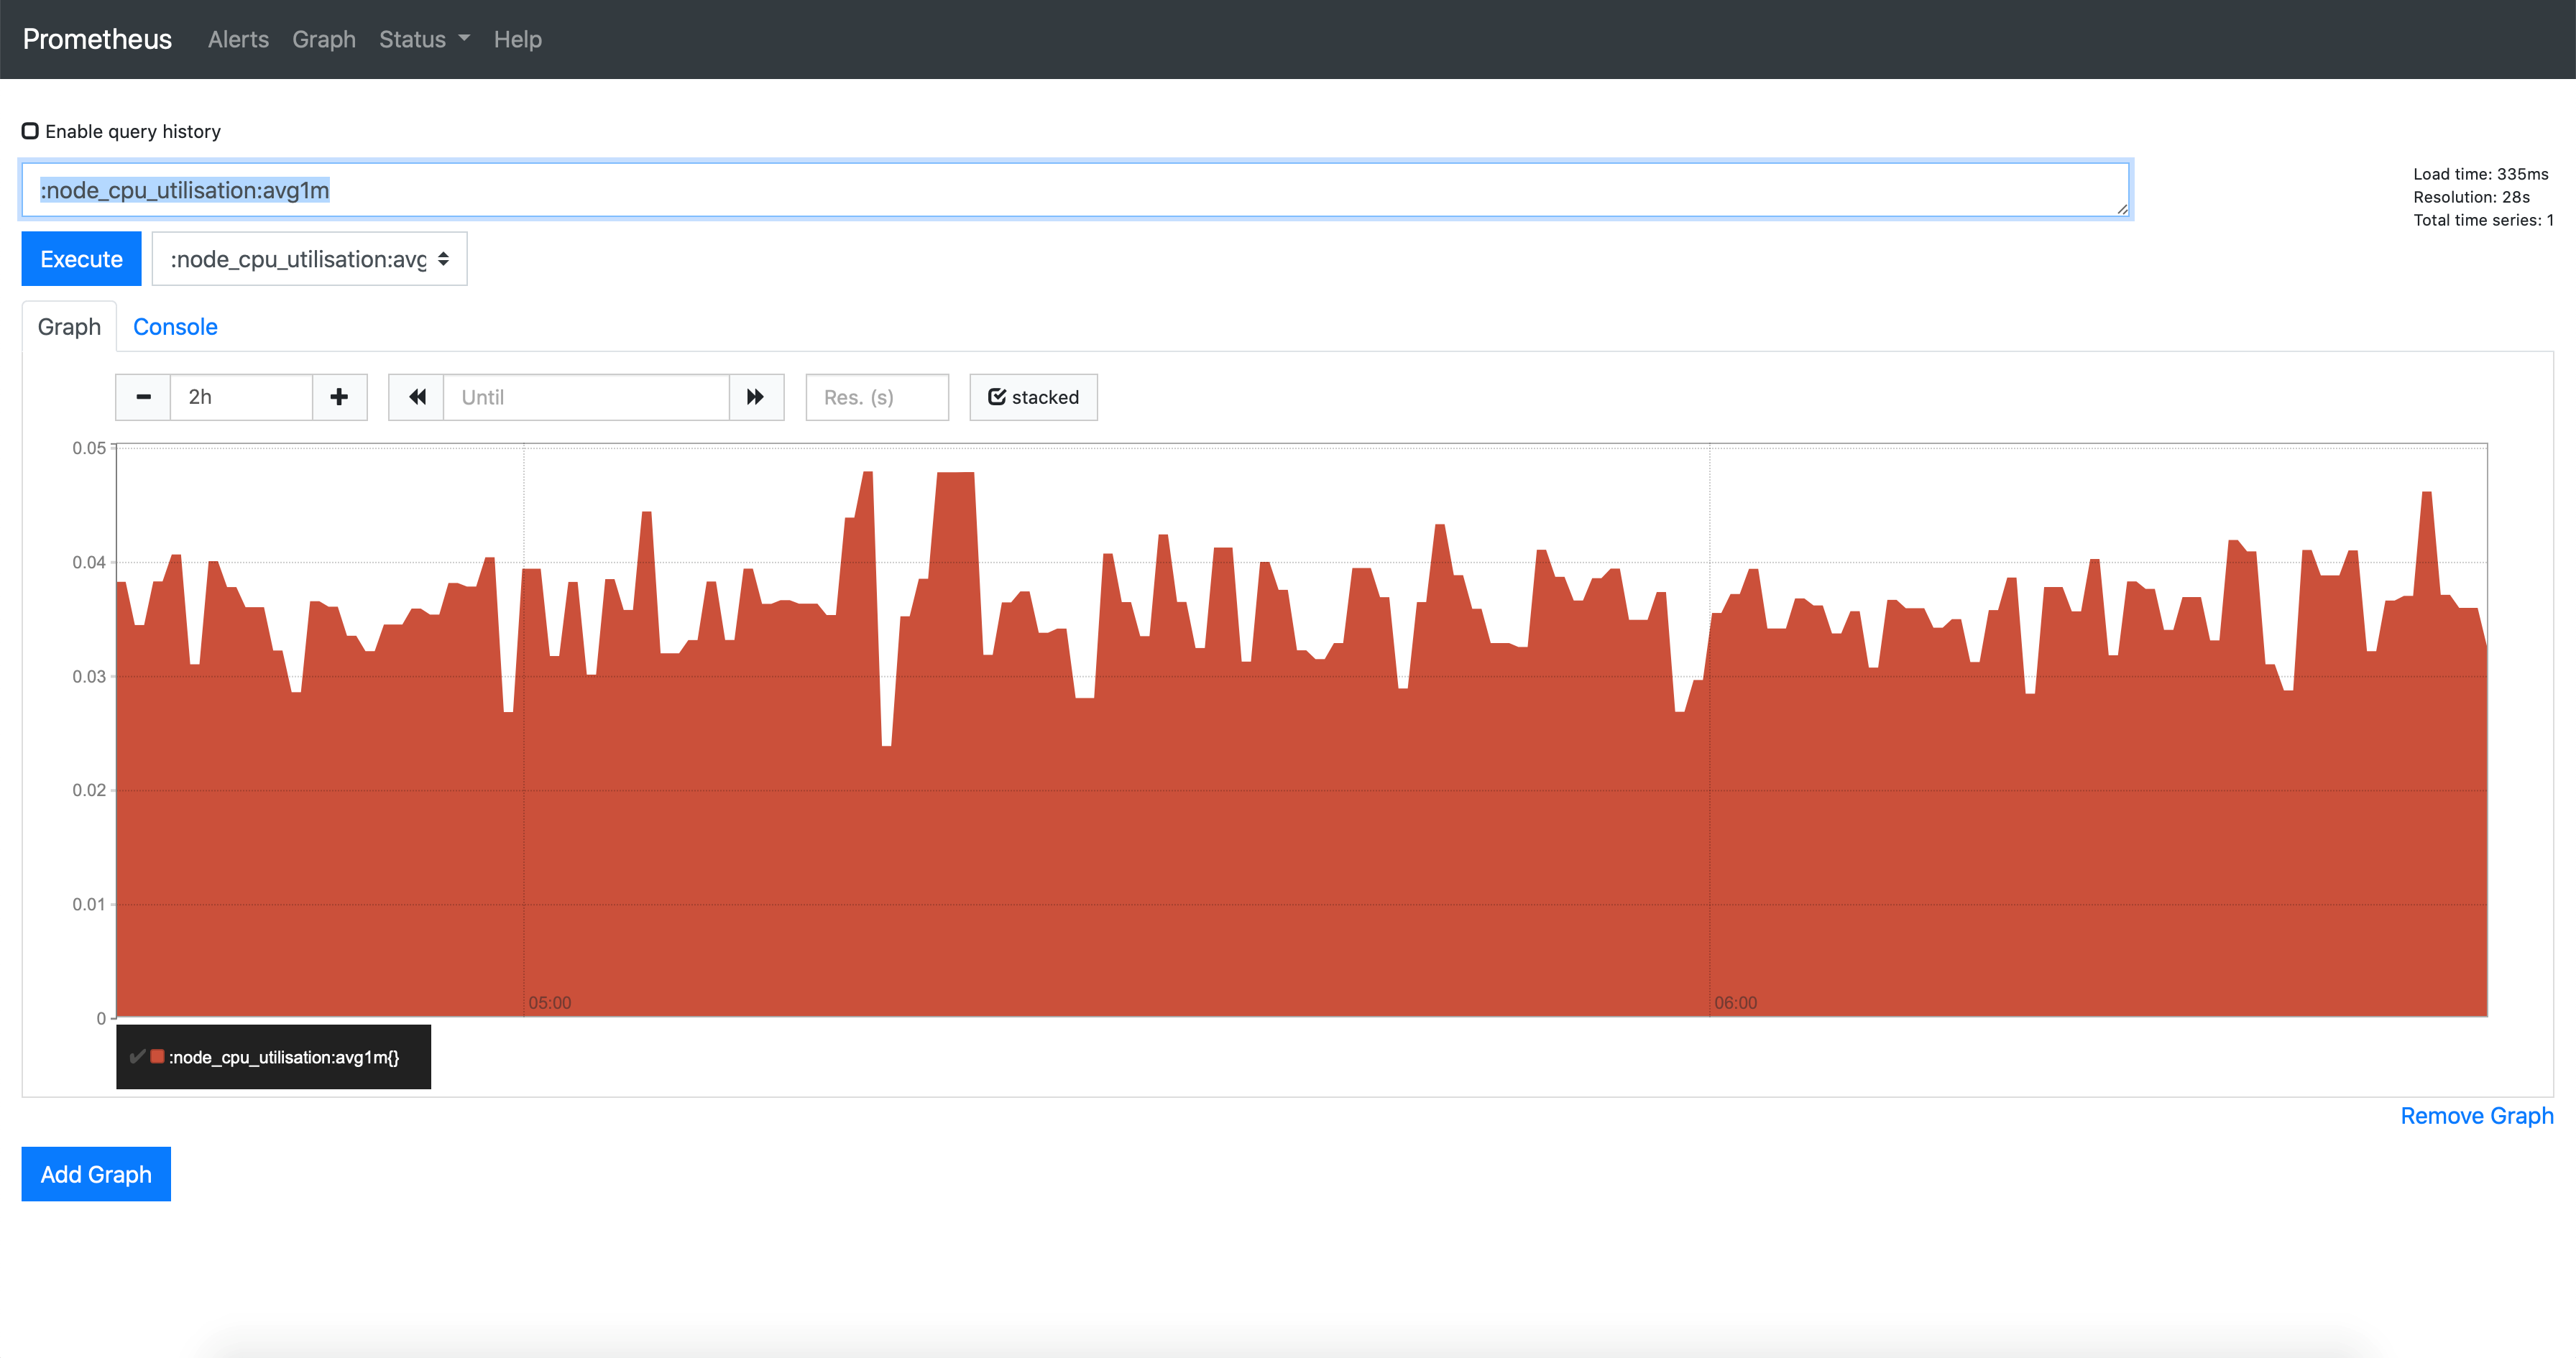
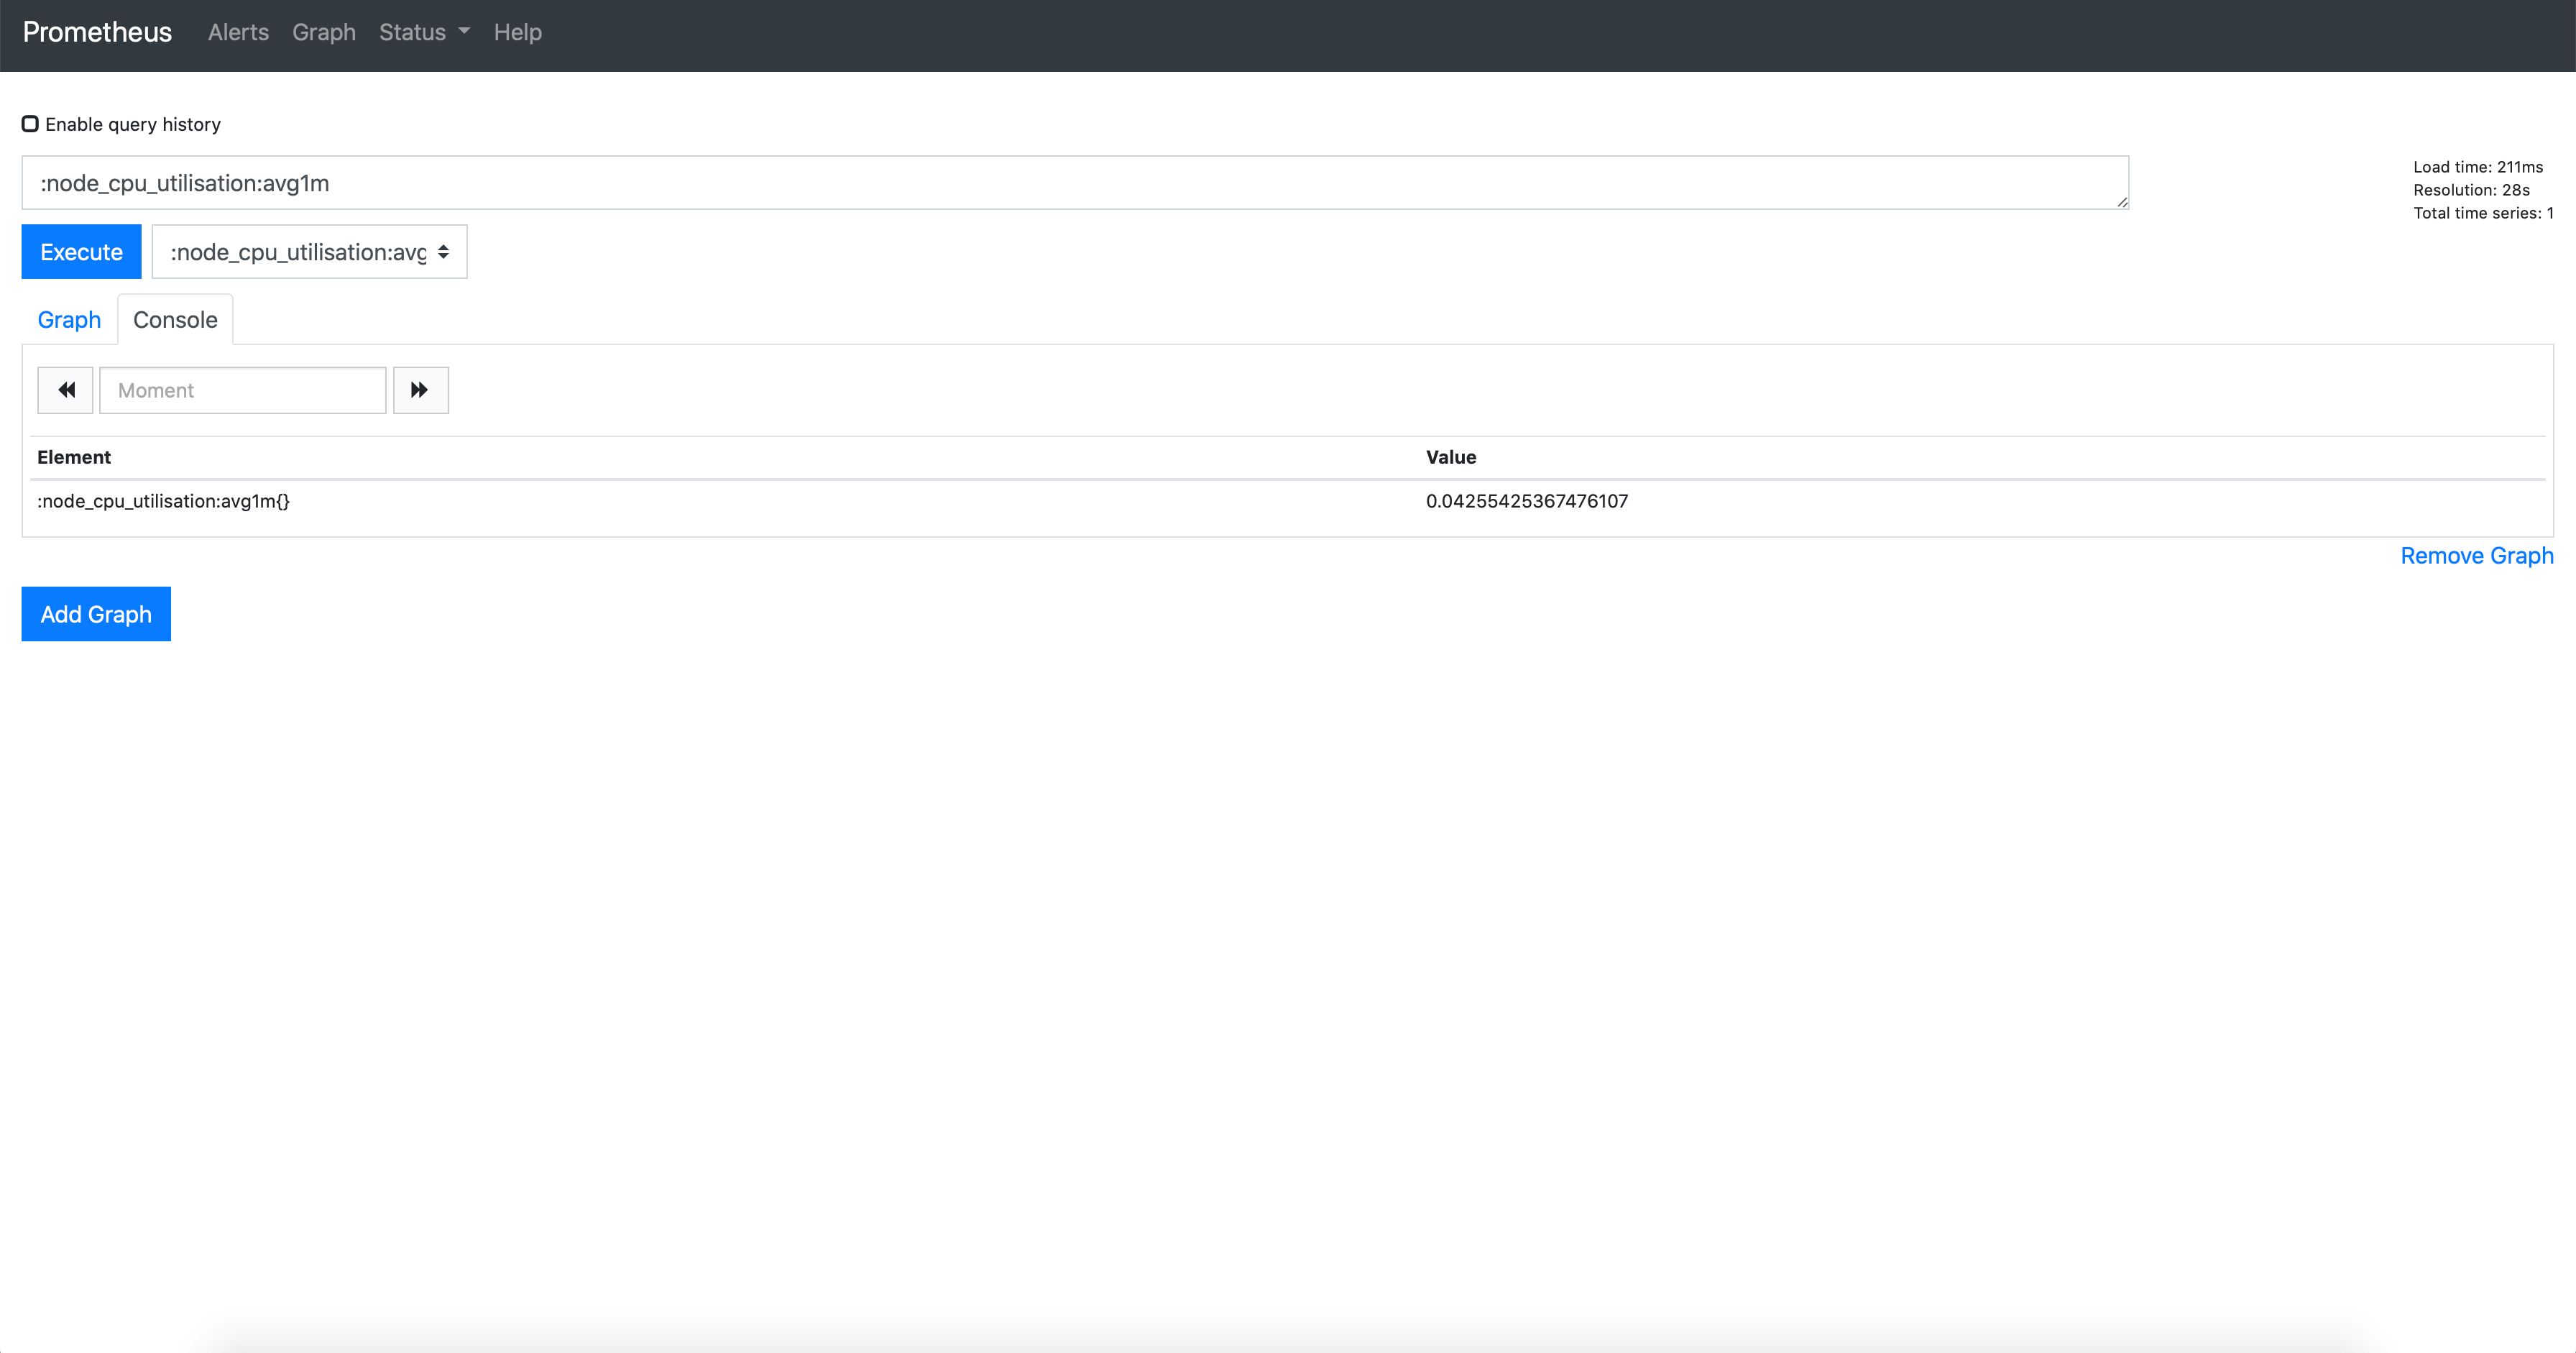
 Query 3: node_cpu_utilisation:avg1m
Output
Graph:
Console:
Comments or questions about this documentation? Contact us for support!

