Sample Prometheus queries
From Genesys Documentation
This topic is part of the manual PrivateEdition/Current/Developers for version Current of Genesys Multicloud CX Private Edition.
Sample Prometheus queries to collect metrics.
Related documentation:
RSS:
Here are some sample Prometheus queries to collect metrics. The result of each query in Prometheus can either be shown as a graph or viewed as console output.
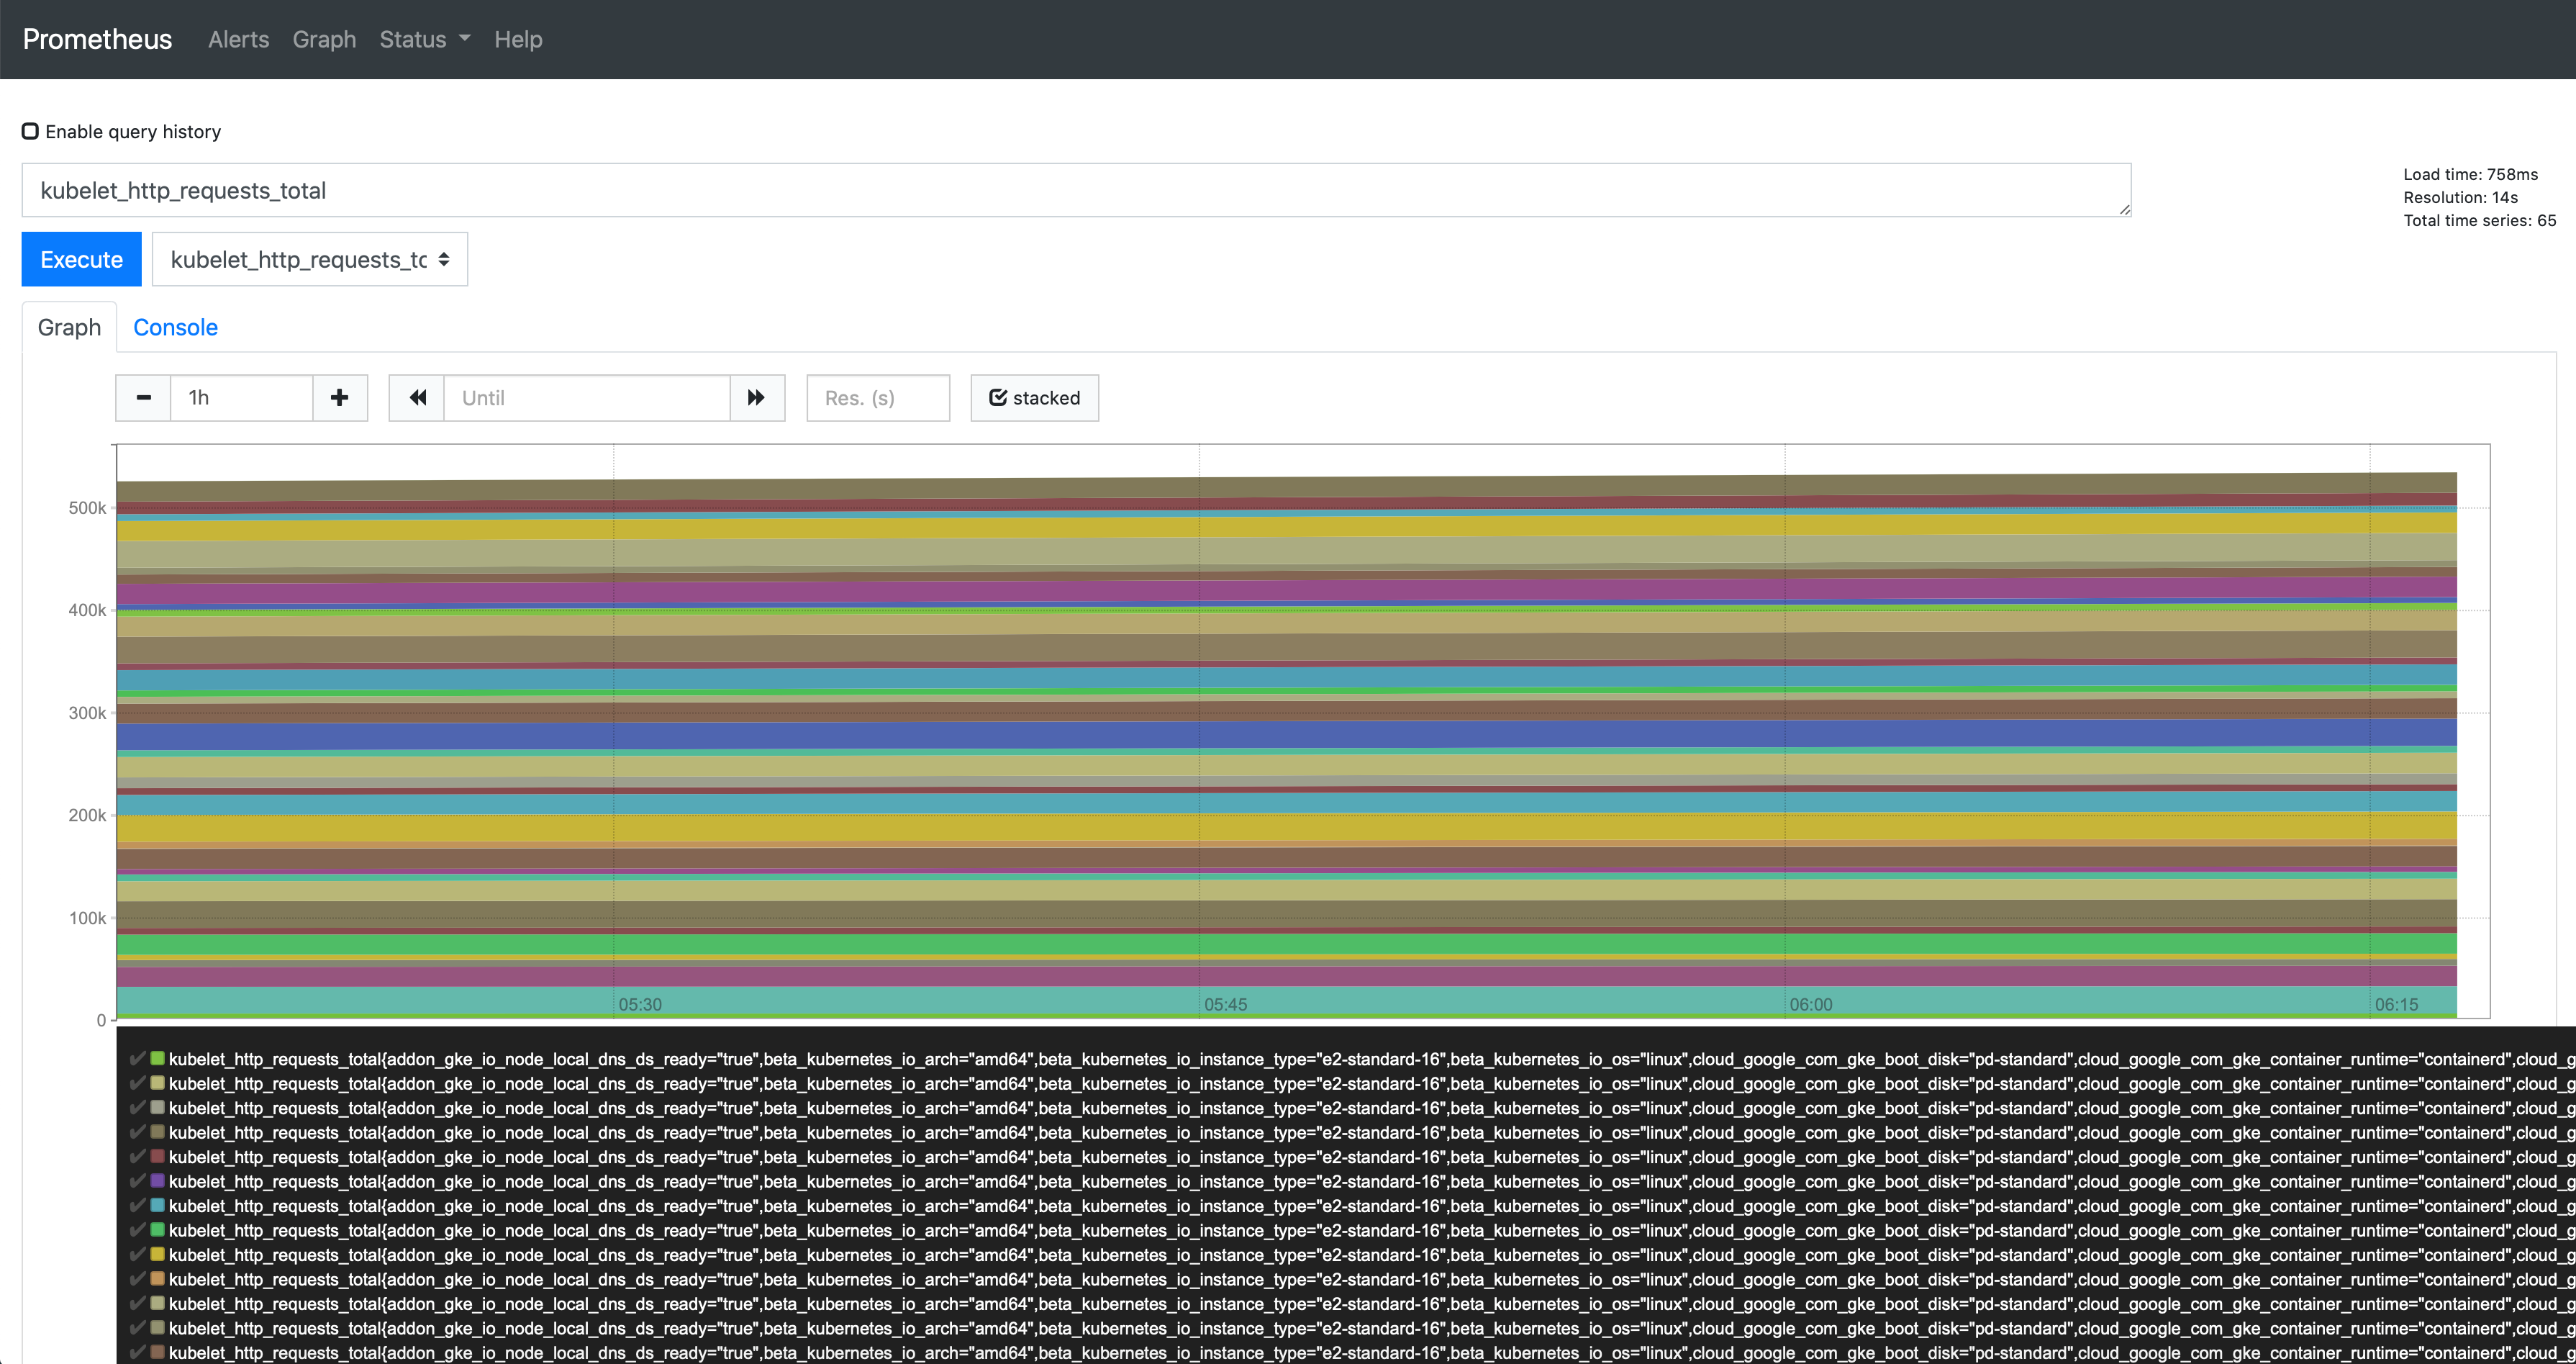
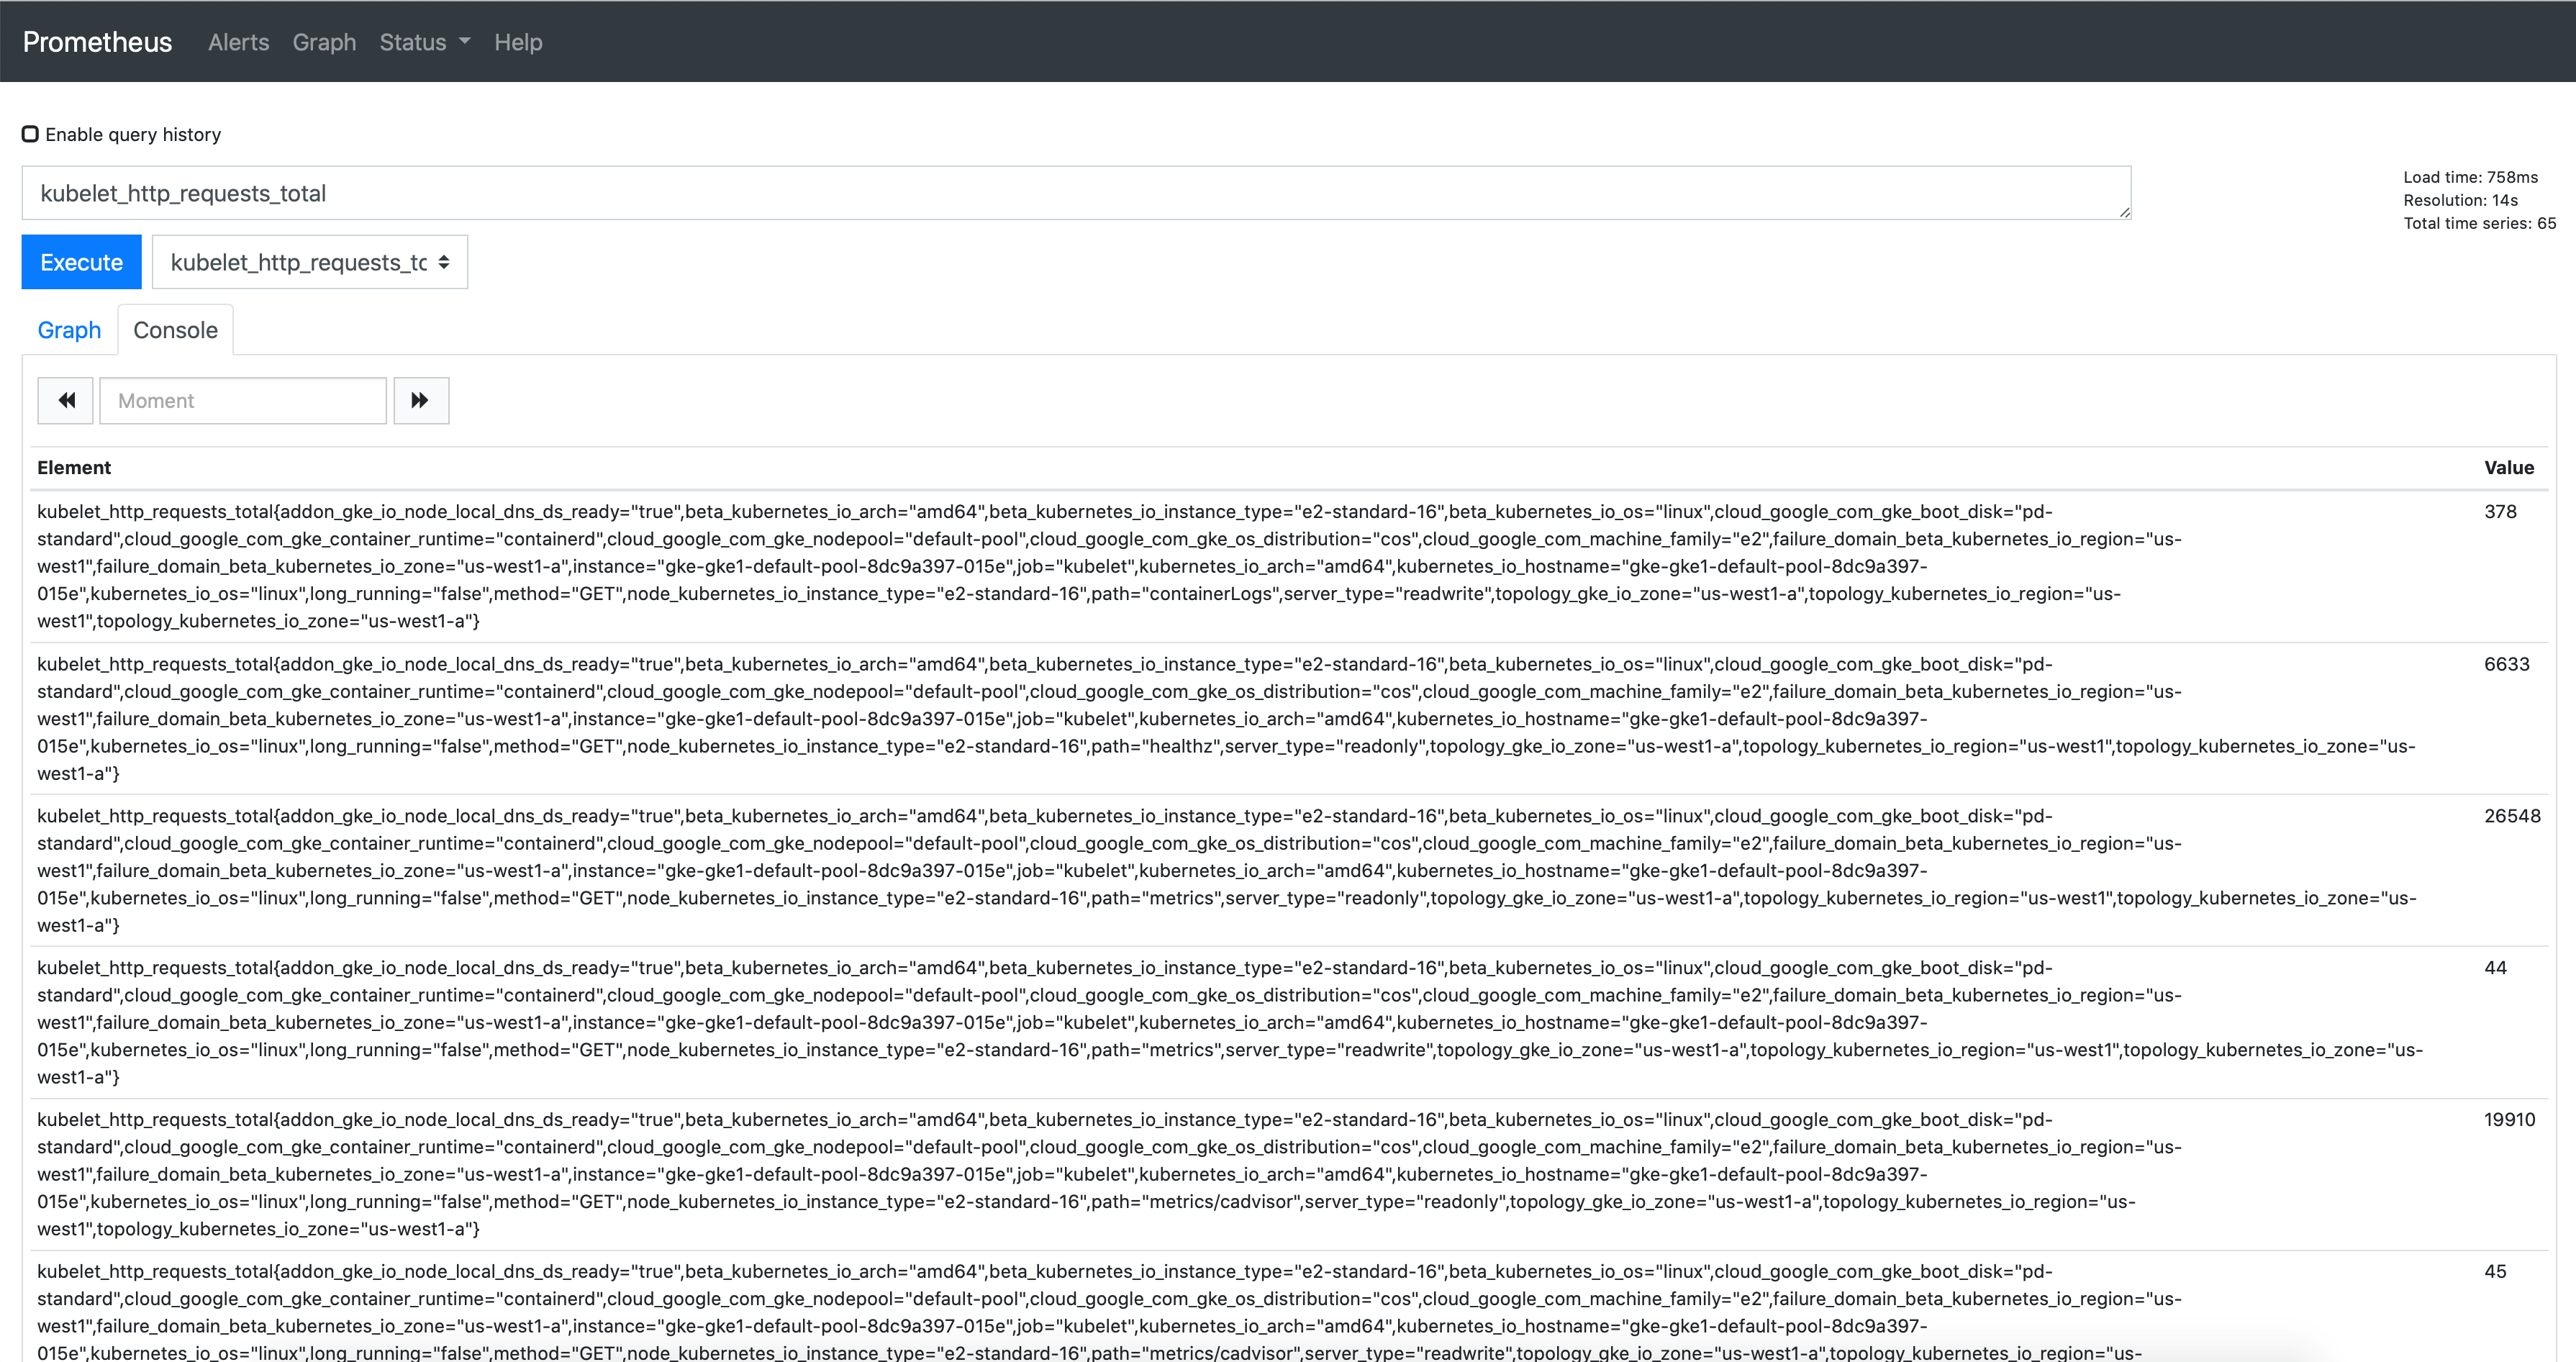
Query1: kubelet_http_requests_total
Output:
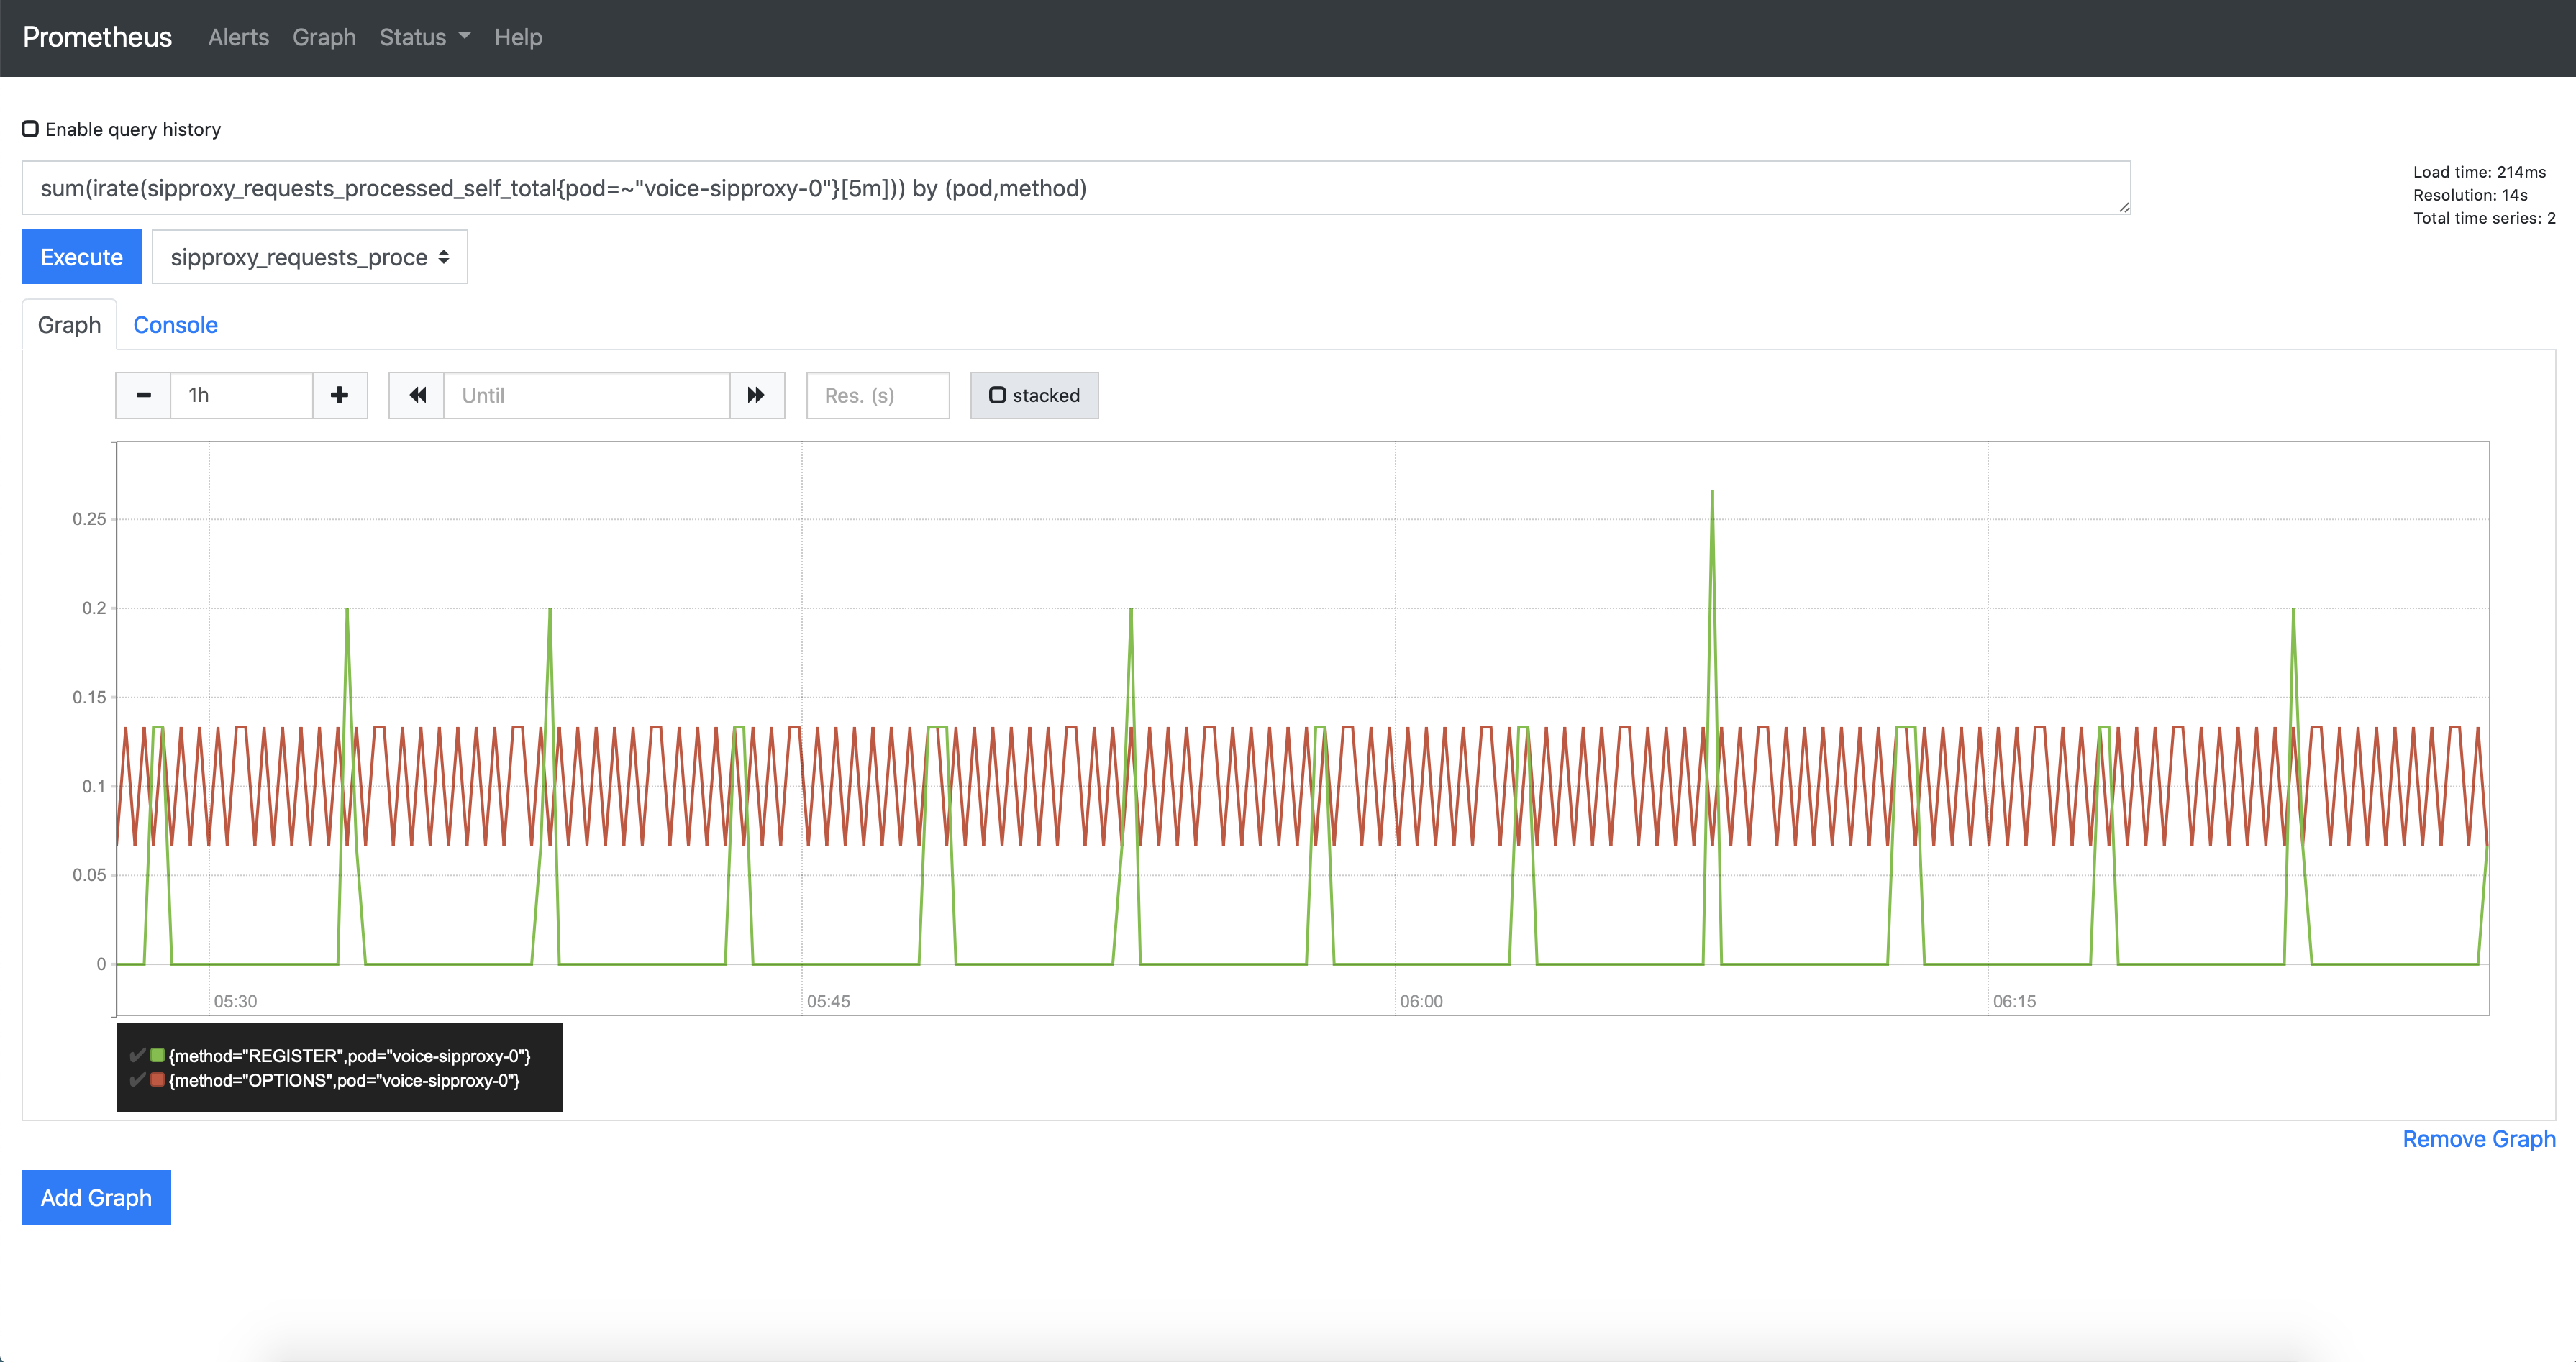
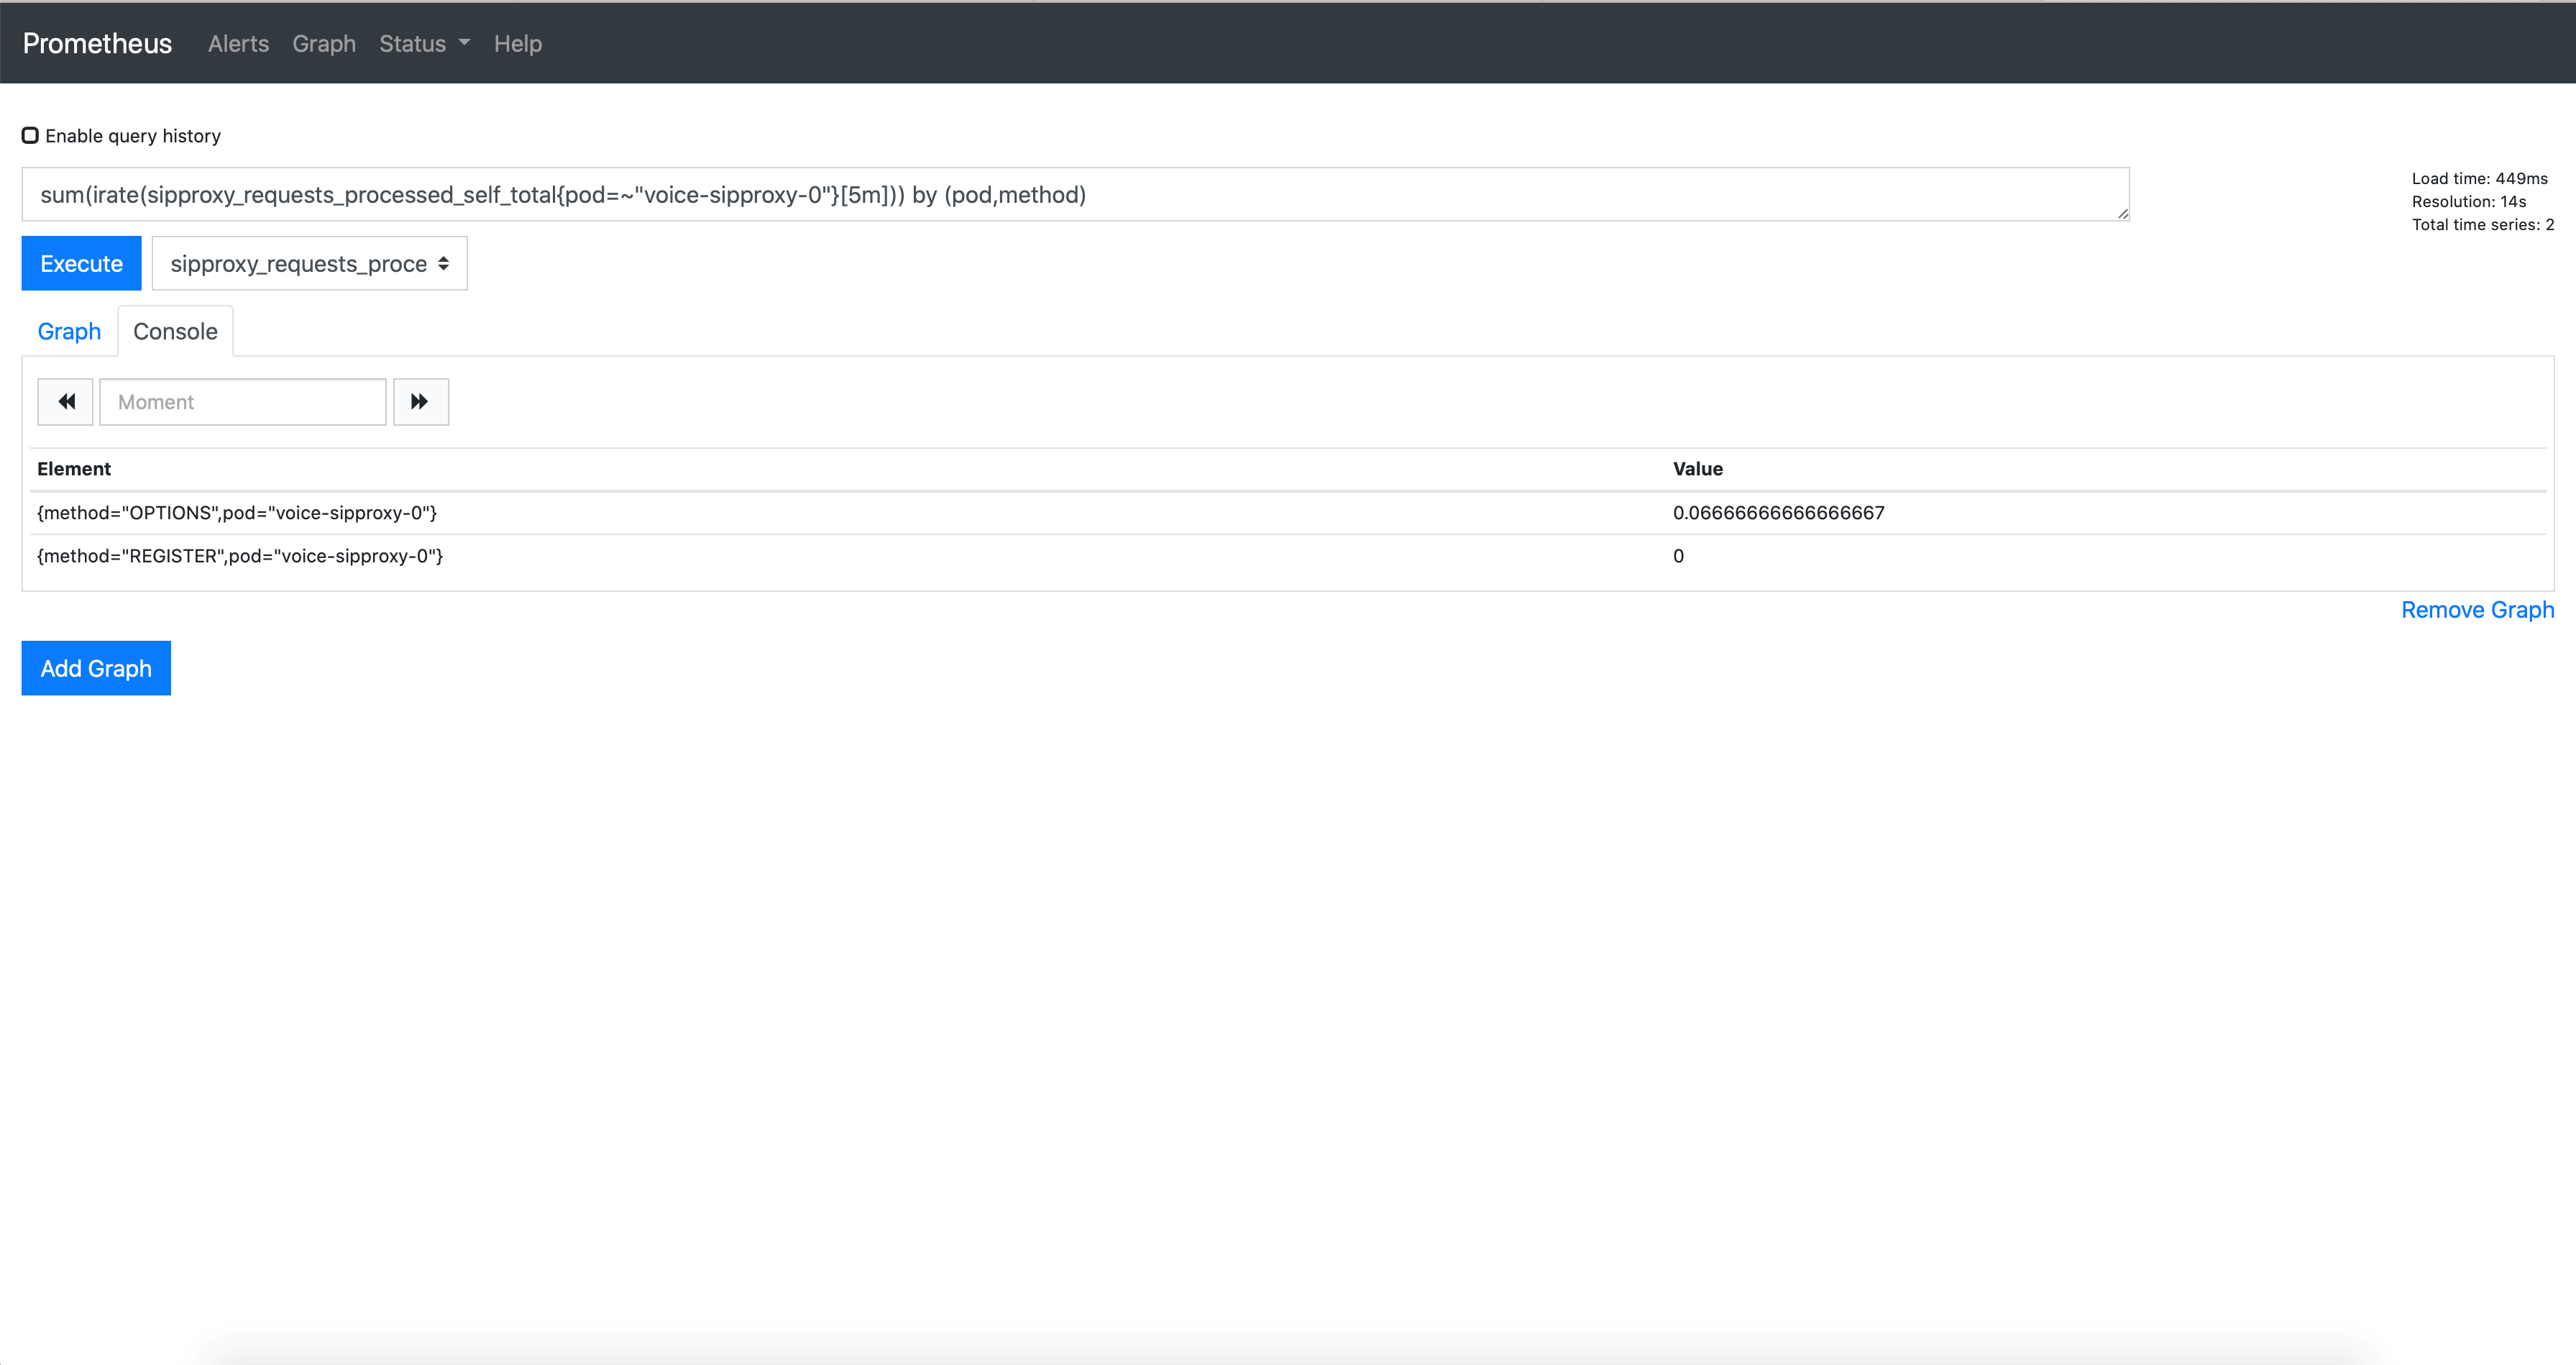
Query 2: sum(irate(sipproxy_requests_processed_self_total{pod=~"voice-sipproxy-0"}[5m])) by (pod,method)
Output
Graph:
Console:
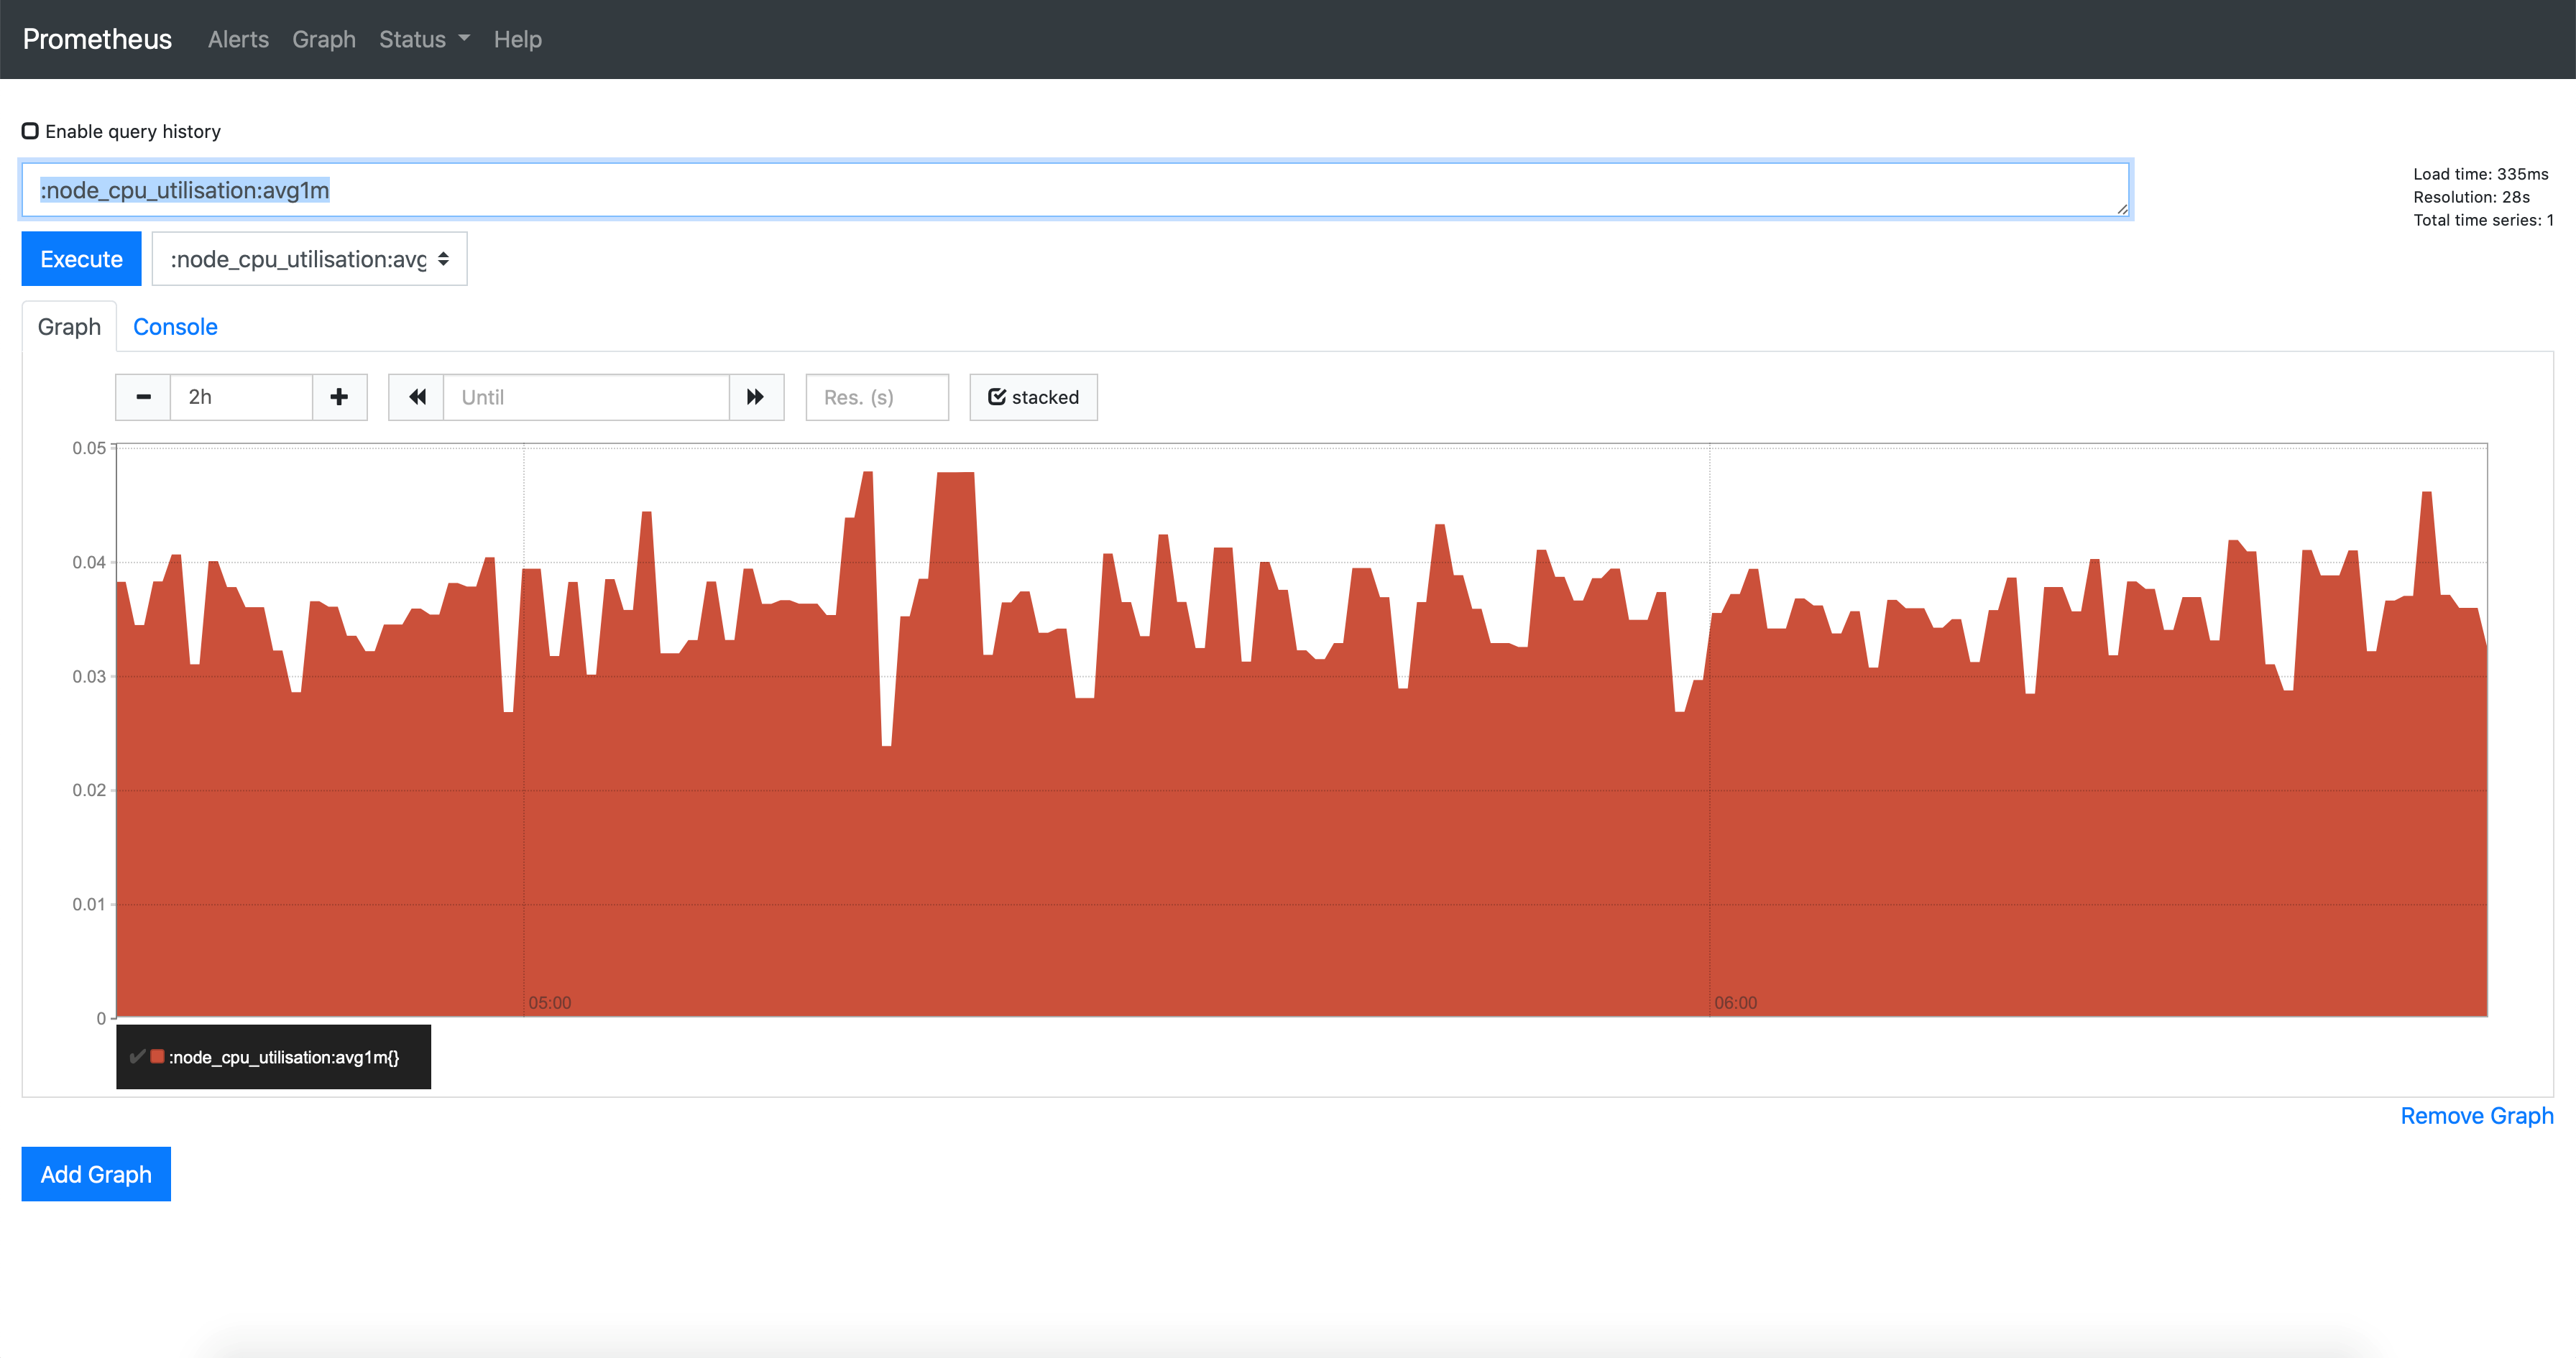
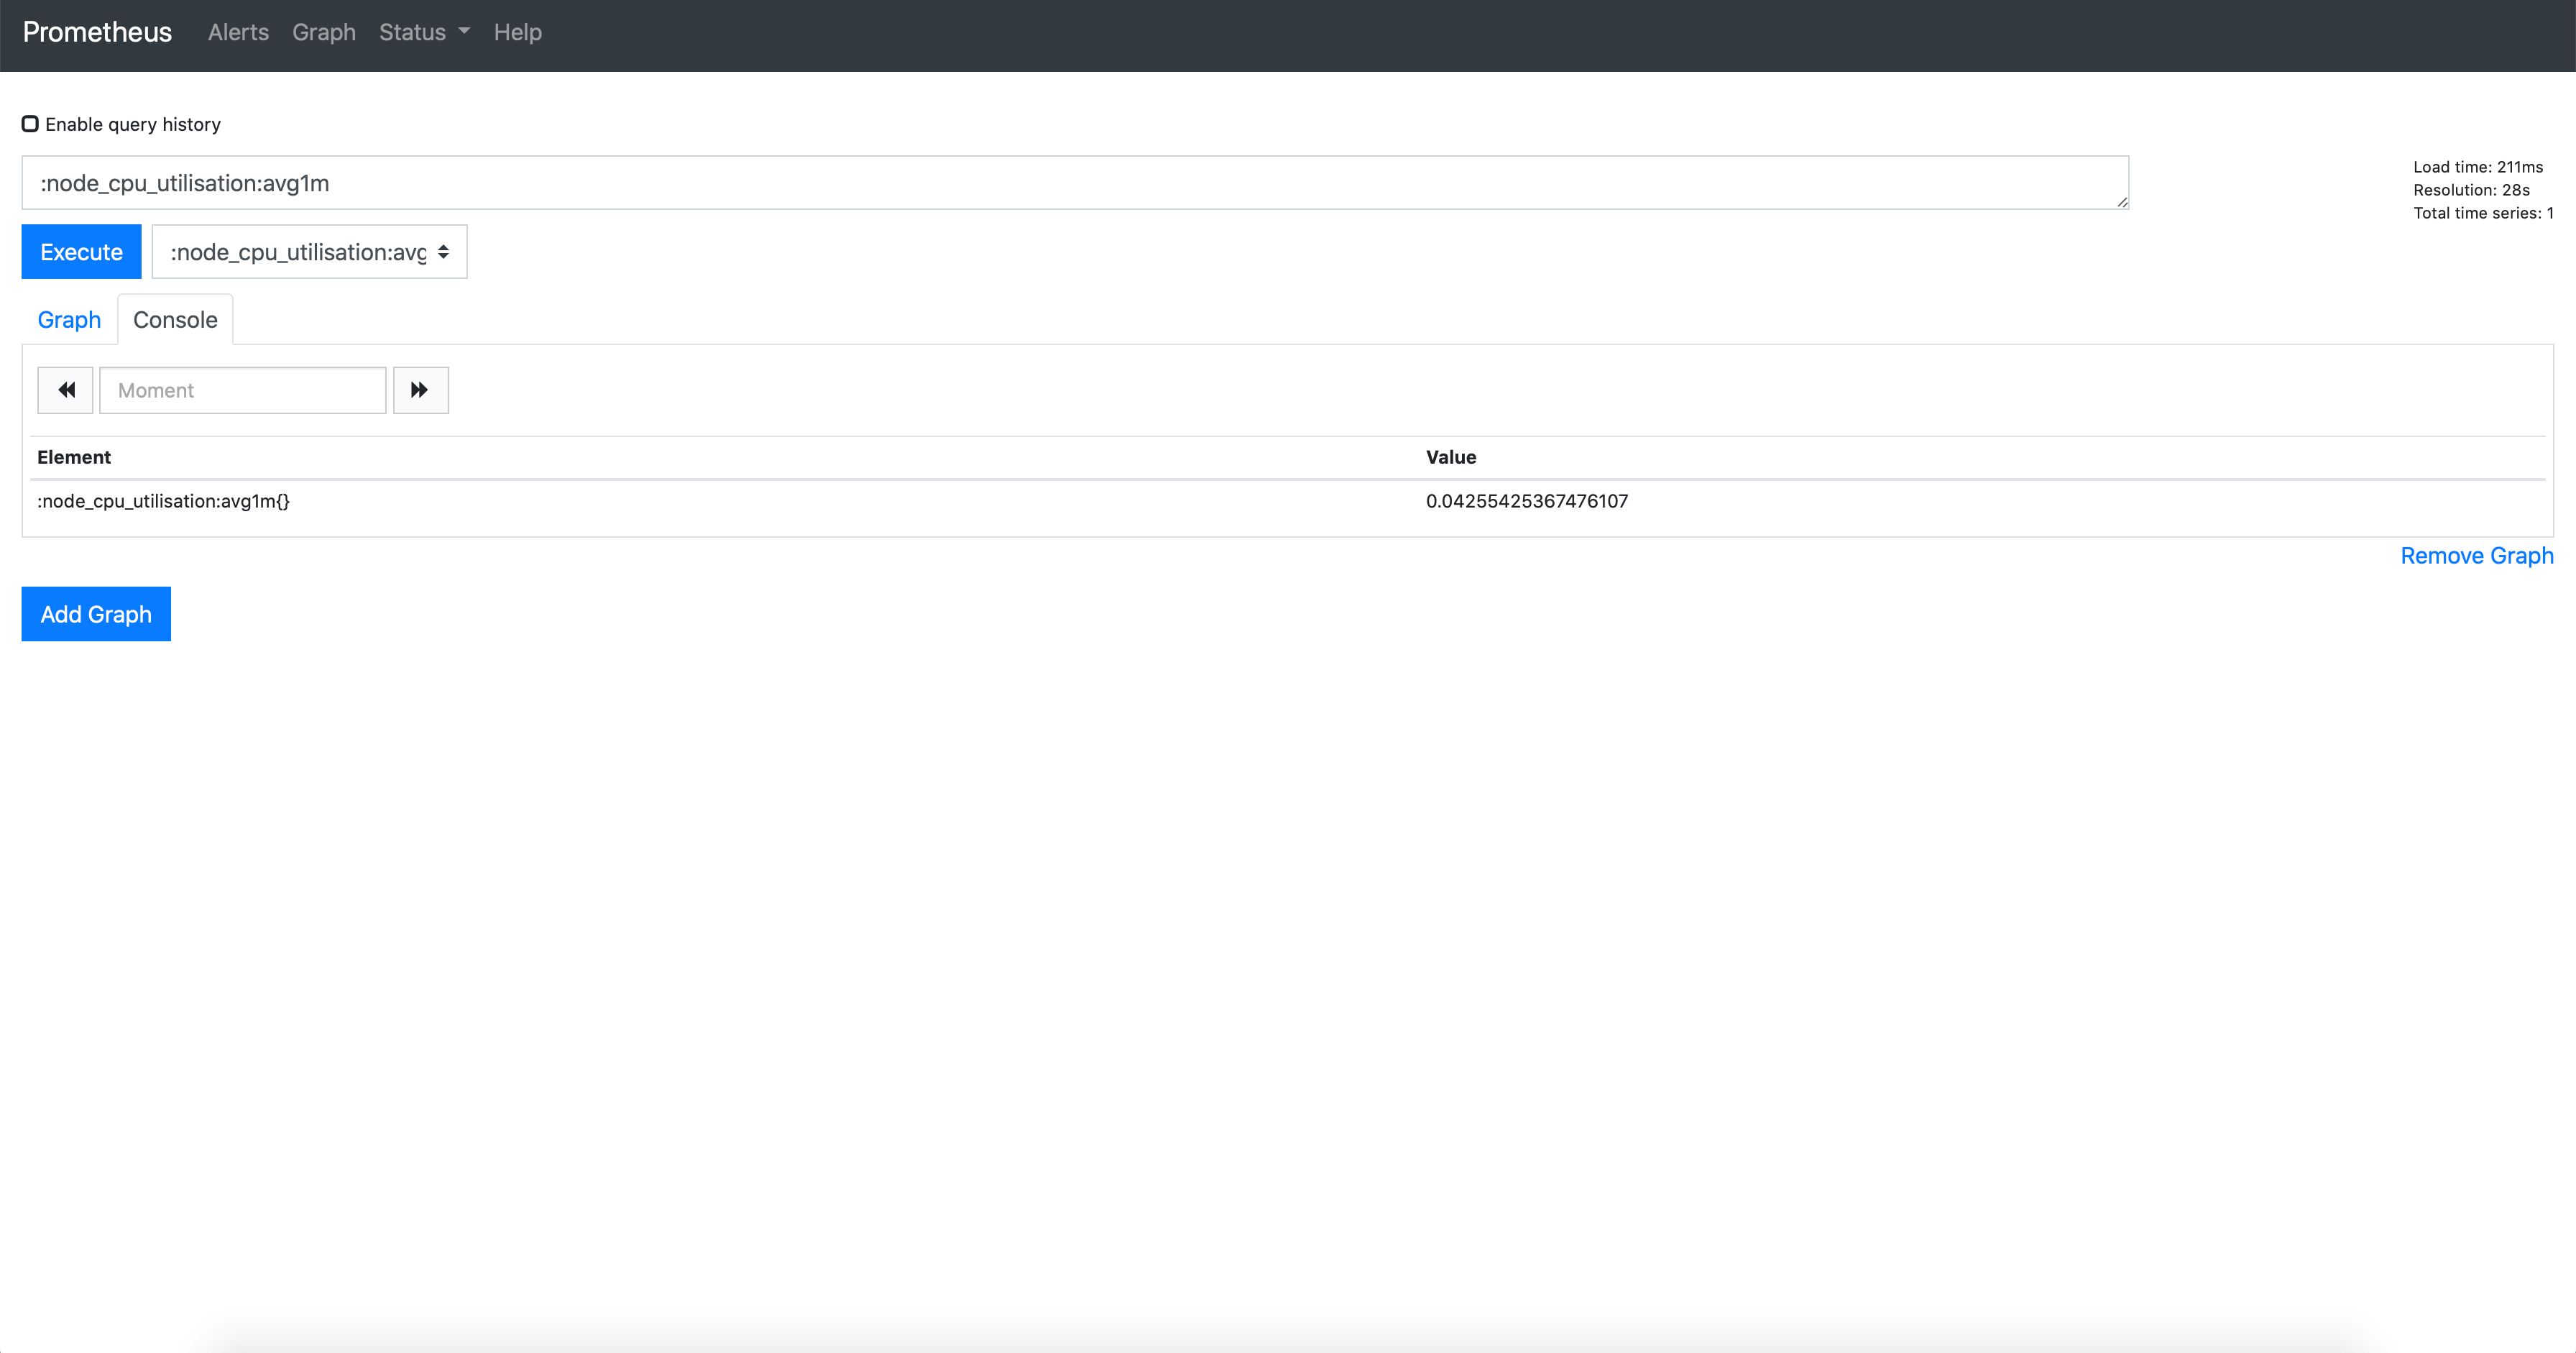
 Query 3: node_cpu_utilisation:avg1m
Output
Graph:
Console:
Comments or questions about this documentation? Contact us for support!

