
Monitoring your services
Contents
Learn how to set up monitoring for the cluster and your private edition services.
Enabling monitoring for your services
This topic describes how to enable monitoring for your services in OpenShift Container Platform and GKE Platform. You can find instructions on setting up service monitoring for your particular cloud platform in the following sections:
Enabling monitoring OpenShift Container Platform
Enabling monitoring in OpenShift Container Platform allows cluster administrators, developers, and other users to specify how services and pods are monitored in projects. After you enable this feature, you can query metrics, review dashboards, and manage alerting rules and silences for your projects in the OpenShift Container Platform web console.
To enable monitoring of services, follow these steps.
- Edit the cluster-monitoring-config ConfigMap object.
$ oc -n openshift-monitoring edit configmap cluster-monitoring-config
- Set enableUserWorkload under data/config.yaml to
true.apiVersion: v1 kind: ConfigMap metadata: name: cluster-monitoring-config namespace: openshift-monitoring data: config.yaml: enableUserWorkload: true- Save the file to apply the changes. Monitoring your own services is enabled automatically.
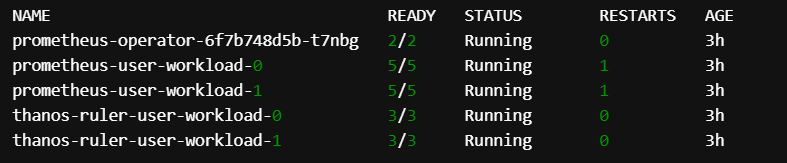
- Optional: Use the following command to ensure the prometheus-user-workload pods are created.
$ oc -n openshift-user-workload-monitoring get pod
- Sample output:
- For more details, refer to Enabling monitoring for user-defined projects.

Enabling monitoring in GKE Platform
This section describes how to use Cloud Monitoring to monitor your Google Kubernetes Engine (GKE) clusters. It also describes how to enable and authorize use of the Monitoring API
Google Cloud operations suite - Cloud Monitoring
Google Cloud's operations suite (formerly Stackdriver) enables a centralized capability of receiving events, logs, metrics, and traces from your GKE platform resources.
Cloud Monitoring tracks metrics, events, and metadata from GKE platform, uptime probes, and services. Stackdriver ingests that data and makes it available via dashboards, charts, and alerts.
For more details, refer to https://cloud.google.com/monitoring/docs.
Enable cloud monitoring
Supported values for the --logging flag for the create and update commands.
| Source | Value | Logs collected |
|---|---|---|
| System | SYSTEM | Metrics from essential system components required for Kubernetes functionality. See a complete list of these Kubernetes metrics. |
| Workload | WORKLOAD | Enable a fully managed pipeline capable of collecting Prometheus-style metrics exposed by any GKE workload. You must configure which metrics to collect by deploying a PodMonitor custom resource. |
Console UI
To enable cloud monitoring through console UI, follow these steps:
- Navigate to Console UI.
- Select Clusters and then select the cluster instance.
- Under Features > Cloud Monitoring, click the Edit icon.
- Select Enable Cloud Monitoring and then select System and Workflow from the drop-down list.
- Click SAVE CHANGES.
This section explains setting up Prometheus on a Kubernetes cluster for monitoring the Kubernetes cluster.
GCloud CLI
To enable cloud monitoring through GCloud UI, follow these steps:
- Log on to the existing cluster.
gcloud container clusters get-credentials <cluster instance> --zone <zone name> --project <project name>
- Configure the logs to be sent to Cloud Monitoring by updating a comma-separated list of values to the
gcloud container clusters updatewith--monitoringflag. Here is an example:gcloud container clusters update gke1 \ --zone=us-west1-a \ --monitoring==SYSTEM,WORKLOAD
Google Cloud Monitoring API
Google Cloud Monitoring API refers to the API that is provided with Google Cloud operations suite to customize your Monitoring solution inside GKE platform.
Stackdriver reads this configuration to prescribe how it processes, manages, and responds to monitored events generated in the cluster.
For more details, refer to Introduction to the Cloud Monitoring API.