
Work with reports
Contents
Read and understand Genesys CX Insights reports, and learn how to drill, filter, or export report results.
Anatomy of a report

Each report is divided into several sections (except for the main section of the report, each section is called an 'editor'):
- Report Details Editor — provides information about the data in the report. You can optionally close this editor by clicking x.
- Prompt Details Editor — provides information about the prompt values used to run the report. You can optionally close this editor by clicking x.
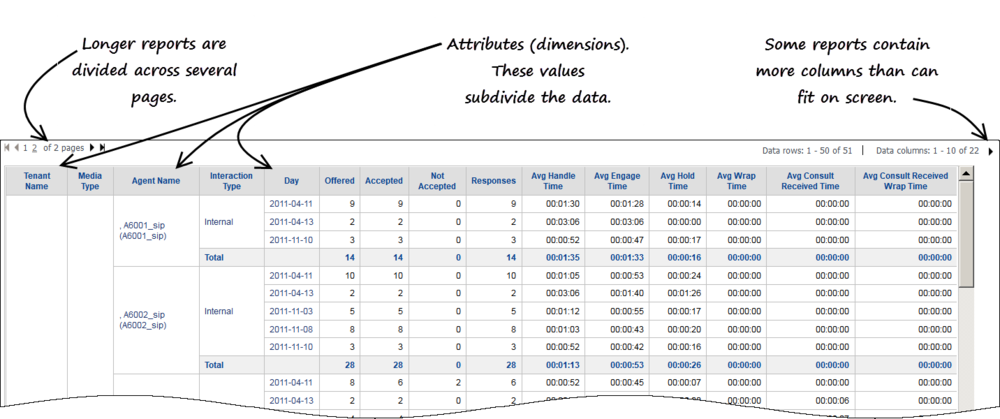
- The report grid — In most cases, reports consist of a simple grid, illustrating the selected data. Some prompt and metric names shown in reports are self-explanatory, but some may require explanation; see the individual report descriptions (see the list of reports) for more information about specific prompts and metrics.
- Other editors appear if you open them, such as the View Filter Editor.
Understand the report grid
The main area of a typical report consists of a simple grid, optimized for on-screen viewing, but also easily printed to PDF, XLS or other formats. (For reports with a lot of columns or rows, you may find it easiest to view your reports as PDFs.)
The first few columns of each report represent Attributes (also known as Dimensions). These are values that divide up the data, and their impact is cumulative, from left-to-right. For example, in the Agent Utilization Report (shown here), the first column divides the data by Tenant Name, the second column subdivides the tenant data by Media Type, the third column subdivides the tenant/media data by Agent Name, the fourth column subdivides the individual agent data by Interaction Type, and the fifth further breaks that down by Day.
Depending on your access role and the report you are viewing, you can manipulate a report in several ways (some of the following topics are described in more detail further down the page):
- Sort—Right-click in a column, and choose an option from the Sort menu, to sort the table by the order of that column. Or, choose Sort Grid to sort the table by more than one column. Not all columns can be sorted.
- Drill—Right-click in a column, and choose an option from the Drill menu, to drill up or down on the data in that column. For example, to change from viewing data for the Month, to viewing it for the Day, Hour, or even the Year. See Drilling in a report Not all columns can be drilled.
- Filter—Right-click in a column, and choose an option from the Filter on menu, to open the View Filter Editor, where you can select one or more conditions. See Filtering report data
- Some reports contain more columns than can usefully fit on screen at one time. You can page through the additional columns by clicking > (More Columns), or you can increase the maximum number of columns shown (Tools > Report Options > Incremental Fetch). On larger reports, it may also be helpful to change the Report Options > Headings > Lock settings.
Video: Drill or filter historical reports in Genesys Engage cloud
This video describes how to read, drill, and filter historical reports in Genesys CX Insights.
Filtering report data

After running a report, you can further filter the data that appears in the report. These filtering options are very powerful, and let you make more selections than those you made on the prompts page when you ran the report. You can add more than one filter on a report.
Use either of the following to methods to filter a report:
Creating a filter using the View Filter Editor
Open the View Filter Editor to manually construct a filter.
- Open and run a report. For example, Agents > Agent Utilization Report.
- Click Tools > View Filter.
- The View Filter Editor appears.
- Click Add Condition.
- The Filter On drop down list appears.
- Click Filter On, and select a value on which to filter. For example, Agent Name will allow you to show only specified agent in the report.
- A list of Available agent data appears.
- Double-click the name of each Agent to include (you can include one, several, or even all), and click Apply.
- You can add more than one filter on a report.
Filtering on selections
Use Filter On to build a filter more quickly.
- Open and run a report. For example, Agents > Agent Utilization Report.
- Right-click a value that you'd like to filter on (a value in one of the attribute columns, such as an agent name).
- Click Filter on Selections.
- The View Filter Editor appears, where you can modify the filter as needed.
Drilling in a report

You can drill on report data to see more detailed (or more general) information.
- To drill on a report, first open and run the report.
- Right-click a heading in the report; a context menu opens. If it is possible to drill on the metric on which you have clicked, Drill appears in the menu.
- The choices available vary depending on the type of data on which you click ('Drill down to Agent Name', 'Drill up to Month', 'Drill down to Interaction subtype', and so on). Not all data can be drilled, and in some reports, no data can be drilled. For example, right clicking the heading Day (in reports where that heading appears, such as Agents > Agent Utilization Report) gives you the option to drill to another time period, such as Month or Year. Note that arrows in the menu indicate whether a drill option is drilling 'Up' or drilling 'Down'.
- Select one of the drill actions that appear. The report automatically updates to account for the change. Open the Drill menu again; note that the available options have now changed.
Printing or exporting a report

You can easily export your reports to a variety of formats, including PDF (ideal for printing) or Excel/CSV (ideal if you want to take the data into other applications, manually edit the output, or what have you).
- Click Report Home > Export > PDF.
- The PDF options page appears in a new browser tab.
- Optionally, select options to control how the report will be exported, such as page size, orientation, or other aspects of formatting. For many reports, it is a good idea to select Fit to 1 Pages Wide and Landscape.
- Click Export. The PDF opens automatically in the browser tab. If you are happy with the output, you can click Download (to save the file) or Print.
Some users find it very useful to export data to a spreadsheet format, as it is then possible to more easily sort and view the data, particularly if there is a lot of data in your report, due to the larger screen area available in a spreadsheet application, such as Microsoft Excel. This is particularly true if you have a great deal of data in your report, or in the case of reports that just can't easily fit in a browser window because they contain many columns or rows.
Learn more

In addition to Get started with Genesys CX Insights and other pages in this document, extensive MicroStrategy documentation is available. (MicroStrategy is the engine that drives Genesys CX Insights.)
- For context-sensitive help to explain the options you see on the Genesys CX Insights GUI, click the ? next to the editor for which you want more information.
- For advanced users seeking detailed information, click the menu next to your user name, and click Help to access the latest online MicroStrategy user guides and manuals, or go straight to the MicroStrategy Community Search Page and enter your search terms there.
Related Topics
- See a complete list of available reports.
- Learn how to customize reports.
- Learn how to generate historical reports.
- View more information about the objects (metrics and attributes) used in reports, and about additional objects that can be used to customize reports: Genesys CX Insights Projects Reference Guide