
Navigating Agent Desktop
Contents
- 1 Main view
- 2 Navigation Bar and Side Bar
- 3 Interaction Bar
- 4 Contact Center Statistics and KPIs
- 5 Chronology slider
- 6 Quick Search
- 7 Page controls
- 8 Grid views
- 9 Show/Hide panel details
- 10 Team Communicator
- 11 Party Action menu
- 12 How to provide feedback when something goes wrong
- 13 Keyboard navigation and accessibility
- 14 Shortcut key combinations
- 15 Keyboard navigation
- 16 Basic navigation using the TAB key
- 17 Navigation Shortcuts
- 18 What next?
- 19 Top 5 topics
Having trouble finding your way around Agent Desktop? If you need help identifying a button or field, hold your mouse pointer over it to reveal a tooltip.
Do you use a screen reader? Do you navigate Agent Desktop using a keyboard? You can find out all about it here!
Main view
The main view lets you access the most common features that you use every day, such as handling calls, changing your status, calling internally, and retrieving your voicemail managing your channels, campaigns, KPIs, and messages.
Watch the video for a quick tour of the Agent Desktop main view.Navigation Bar and Side Bar

The navigation bar lets you switch between different desktop views. It also contains the Status menu and the Main menu. The navigation bar might contain buttons to let you view panels that are specific to your company, including web applications that you use to complete your work.
Connect group
- My Channels: Set your status on individual channels, such as voice and turn call forwarding on or off.
- My History: Search through the history of interactions that you have handled.
- Interactions Search: Search through all interactions in your company database that you are allowed to view.
- Contact Directory: Search for contacts and view their information and history.
Monitor group
- Contact Center Statistics:; View the latest statistics and alerts for your contact center.
The side bar contains the buttons that let you start calls, retrieve your notifications (system messages), and view your voicemail. The side bar might contain custom buttons related to tasks and features that are specific to your company.
- Performance Tracker: View your latest statistics (KPIs) and alerts.
Interaction Bar

Each interaction is represented by a control bar. You can use the control bar to perform basic actions that are specific to the interaction type, such as ending a call.
- Click the control bar for an interaction to give it the focus. All other open interactions are collapsed to the Interaction Bar.
- Click the small colored bar on the left of the interaction control to toggle between pinned mode and floating mode. In floating mode, other open views appear dimmed behind the interaction view.
Entries in the Interaction Bar flash (or blink) when specific events occur that might require your immediate attention.
Contact Center Statistics and KPIs
There are three places where you can view and track your performance and the performance of your contact center:
- The Dashboard region in the Monitor view
- The Performance Tracker view in the Sidebar
- The Statistics Gadget tool in the Navigation Bar.
Note: Some or all of these features might not be available in your environment.
Here are the icons that you might see in the Dashboard (Contact Center Statistics) region and Performance Tracker view:
- A worst icon (
 ) is displayed if the evaluation of the performance is below the expected worst level for the agent statistic (KPI) or contact center statistic.
 - An error icon (
 ) is displayed if the evaluation of the performance is below the expected error level for the agent statistic (KPI) or contact center statistic.
 - A warning icon (
 ) is displayed if the evaluation of your performance for the agent statistic (KPI) or contact center statistic goes beyond the expected warning level for the statistic.
Dashboard
The items displayed on this region are Contact Center statistics for Routing Points, Queues, and other contact center facilities. The Dashboard region displays statistics that summarize the state of various conditions, such as waiting time, calls in queue, average maximum waiting time, service level, and answered and abandoned calls, that are monitored by your contact center.
Click the Contact Center Resource column head to change the sort order of the resources.

Performance Tracker
This view displays the list of your Key Performance Indicators (KPIs).
The KPIs that are displayed are set up by your system administrator.
Your KPIs are shown as tri-colored bars with a white triangle indicating your standing. The name of the KPI appears just below the bar. If you are not meeting your KPIs, the white arrow points to yellow and red. When you are meeting your KPIs, the while arrow points to green. Each statistic also displays the statistic value under the colored bar to indicate what your current value is for the statistic. If you have any warnings, they are displayed next to your statistic value.
![]()
Statistics Gadget
The Statistics Gadget helps you to stay up to date on certain key statistics. Your administrator decides which statistics are available for you to view.
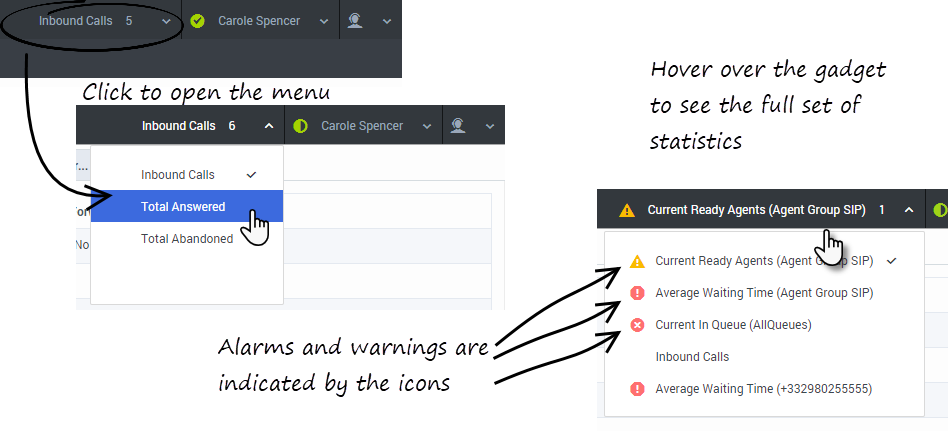
The Statistics Gadget displays one statistic at a time, giving you the current status of service level, number of calls waiting, number of calls you have handled, and so on.
Hover your mouse pointer over the Statistics Gadget to see the current values for all of the statistics that have been assigned to the gadget by your administrator.
If more than one statistic has been assigned to the gadget, click it to open a list of currently available statistics and select a different one to display. A check mark is displayed next to the current statistic.
Here are the icons that you might see in the Statistics Gadget:
- A worst icon () is displayed if the evaluation of the performance is below the expected worst level for the agent statistic (KPI) or contact center statistic.
- An error icon () is displayed if the evaluation of the performance is below the expected error level for the agent statistic (KPI) or contact center statistic.
- A warning icon () is displayed if the evaluation of your performance for the agent statistic (KPI) or contact center statistic goes beyond the expected warning level for the statistic.
Tracking Your Time
In most cases, the time you spend handling an interaction is tracked from the moment you click Accept to the moment you click Done. However, if you are an agent enabled to handle multiple channels of interactions, your administrator can choose to track your time based on the total time spent handling all the interactions that are related to a single Case. You could be talking to a contact on the phone, send them a Chat message, and then compose and send a follow-up email. All these interactions together comprise a single Case.
If you are handling multiple interactions that are not part of the same Case, your administrator might choose to track your time by how many seconds elapsed between you accepting the interaction and you marking it as Done. That means if you have several chat interactions with different contacts all going on at the same time, your time on each interaction might not be accurately tracked. You administrator might choose to track your time based on how long each interaction was the active interaction. When you are actively working on one interaction, the other interactions are in the background. Active interactions are said to be in focus. Only one interaction can be in focus at a time. Your administrator might track your time based on the total time each interaction had focus.
If you are unsure how your time is being tracked, ask your supervisor or administrator.
Chronology slider

The chronology slider lets you search the contact history for interactions that took place within a certain time period. The slider has four positions:
- All—Search the entire database from the most recent interaction back to the earliest interaction
- Last Month—Search the database from the most recent interaction back to one month ago
- Last Week—Search the database from the most recent interaction back to one week ago
- Last Day—Search the database from the most recent interaction back to one day ago
Quick Search

Page controls

Page through the list of search results by doing any of the following:
![]() = Go to the Next Page
= Go to the Next Page
![]() = Go to the Previous Page
= Go to the Previous Page
![]() = Go to First Page
= Go to First Page
![]() = Go to Last Page
= Go to Last Page
Grid views

In the Grid view, search results are returned in tabular form and sorted according to the default search field, such as Last Name. The Grid view can be used to help to refine your search by sorting the results.
Click a column head in the Grid view to sort the list based on that criterion. Click a column head a second time to switch between ascending and descending sort order.Show/Hide panel details
The Show Details Panel/Hide Details Panel button (![]() ) enables you to specify how the Details panel is displayed. The details panel can be shown or hidden, and, when shown, can be displayed to the right of the window.
) enables you to specify how the Details panel is displayed. The details panel can be shown or hidden, and, when shown, can be displayed to the right of the window.
Click the Show Details Panel/Hide Details Panel button to choose one of the following views:
![]() : Displays the Details panel to the right of the workspace area.
: Displays the Details panel to the right of the workspace area.
![]() : Hides the Details panel.
: Hides the Details panel.
Team Communicator
Team Communicator lets you find someone in your company's internal directory (such as a team member, a routing point, or an agent group), and sometimes someone outside your company, such as an external resource person or even a customer contact. It's useful for getting help or consulting with someone while working with an interaction.
To start a call, just click in the Team Communicator search field and start typing a name or number.You can also filter the search results by using these buttons:
 to search all contacts
 to search your favorites
 to search recent contacts
 to group (or ungroup) your results by category or type
If you miss a call, a red indicator is added to the clock button, like this: ![]() , to tell you how many calls you missed. Click it to display the following information about any missed calls: date, time, and known contact details.
, to tell you how many calls you missed. Click it to display the following information about any missed calls: date, time, and known contact details.
Tip: When you close the Team Communicator, or if you switch the filter to All contacts or Favorite contacts, the red indicator on the Recent button disappears if you have viewed your recent and missed calls, or if you have called back all of your missed calls.
When you are on a call and your call becomes disconnected, use the Team Communicator to call back your contact by filtering on Recent contacts.
Watch the video for a short demonstration of how to use Team Communicator.
Party Action menu

The Party Action menu is a part of every interaction. You can use it during an interaction to launch a secondary interaction or carry out other actions.
The Party Action menu can be used to launch an email interaction while you are talking to a contact. You can also use the Party Action menu to call back the contact if you become disconnected.How to provide feedback when something goes wrong

Sometimes web-based applications don't work as expected. There might be network connection issues, or the system that sends you phone calls, emails, and chats might be slow or behaving in odd ways. Sometimes the sound quality of a phone call is bad. Sometimes an error message is displayed on your desktop.
These and other issues are problems that you should report to your supervisor. Open the Main menu and select Feedback to open the Feedback window. Describe the problem or suggestion by typing in the text box, then click Send to submit your feedback. Your administrator might limit the number of characters that you can send as feedback; if you exceed this limit a warning message is displayed to you. Edit your comment before sending it to ensure that it does not exceed the character limit. This information, along with logs about what you were doing in your most recent Workspace Agent Desktop session, are sent to Genesys and are available to Customer Care for later reference.
If for some reason Workspace Agent Desktop becomes disconnected from your network you can reconnect by one of the following methods:
- Refresh your browser. If the Unable to connect dialog box is displayed, click Login.
- Close your browser, launch a new one, and log in again.
Workspace automatically opens the Connection Lost window when you reconnect. Click Continue to open the Feedback window so you can write a report about the disconnection problem immediately.
After you complete a feedback report, please tell your supervisor about it. He or she might want to call Genesys Customer Care about the problem and will be able to refer to the feedback you just submitted.Keyboard navigation and accessibility
Agent Desktop lets you navigate the interface entirely by keyboard. This means that you don't have to use a mouse to activate different features or select buttons.
It also means that you can use a screen-reader application to perform all the functions you need.
Whenever an event happens in Agent Desktop, like you get a new interactions or an error message is displayed, Agent Desktop makes a sound to alert you.
All the different ways that you can use the keyboard and a screen-reader to move around are described in this section.
Agent Desktop lets you use keyboard shortcuts combinations for some common actions. Ask your administrator for a list of the shortcuts that are set up for Agent Desktop.
Shortcut key combinations
A shortcut is a combination of keys that you press to make something happen in an Agent Desktop window.
OS shortcuts
The computer operating system also has shortcut keys to let you copy, cut, paste, undo, delete, find, maximize window, minimize window, open menu and select command, switch application, cancel, change focus, and so on. Consult your operating-system documentation for a list of supported keyboard shortcuts.
Agent Desktop shortcut keys
Agent Desktop supports three shortcut key combinations that you can use to make you more productive. These are the default shortcuts (your administrator might have set up different shortcuts for you):
- Alt+N — Jump to the next interaction if you have multiple interactions open
- Alt+B — Jump to the previous interaction if you have multiple interactions open
- Alt+L — Jump to the last error message that you received
Keyboard navigation
Agent Desktop supports keyboard navigation for all features, functions, options, and menus.
If you do not use a mouse or if you are using a device for accessibility that needs keyboard navigation, you can still use all the Agent Desktop features. Many expert users prefer to use keyboard navigation to maximize productivity.
Colors and appearance change as you select different items on the Agent Desktop. For example, buttons change color and menus open with the current selection highlighted by color.
Basic navigation using the TAB key
The simplest way to navigate by keyboard is to use the TAB and SHIFT+TAB keys.
- Tab—Moves your focus to the next menu, field, button, view, and so on.
- Shift + Tab—Moves your focus to the previous menu, field, button, view, and so on.
Movement occurs from left to right and from top to bottom, unless the ordering of components dictates otherwise. Navigation moves from component to component within a view, and from view to view within the application.
Navigation Shortcuts
This table shows you the keyboard shortcuts that let you control Agent Desktop without using a mouse.
| Shortcut | Description |
|---|---|
| Left Arrow |
|
| Right Arrow |
|
| Up Arrow | Move up in lists and menus. |
| Down Arrow | Move down in lists and menus. |
| Alt+Down Arrow | Open a selected drop-down list. |
| Enter |
For a modifiable list, apply the edit mode, or validate the modification. For a button, execute the associated action. For a menu item, execute the associated action. |
| Space | For some controls, select or clear the check box that has the focus. |
| Escape | For a modifiable list, cancel the edit mode. |