Customer journey (Genesys Cloud)
Contents
Learn about the customer journey data that Genesys Cloud agents see.
Prerequisites
- Configure the following permissions in Genesys Cloud:
- Journey > Event > View (to see events on the customer journey map)
- Journey > Event Type > View (to see event information)
- Journey > Outcome > View (to see outcomes achieved and scores for a visit)
- Journey > OutcomeScores > View (to see real-time predictions)
- Journey > Segment > View (to see matched segments for a visit)
- Journey > Session > View (to see live tracking information about visitors who are currently on your website)
- Journey > Session Type > View (to see session information)
- Routing > Wrap-up Code > View (to see wrap-up codes in conversation session cards)
- Routing > Queue > Search (to see queue information in conversation session cards)
Improve your view of customer journey data
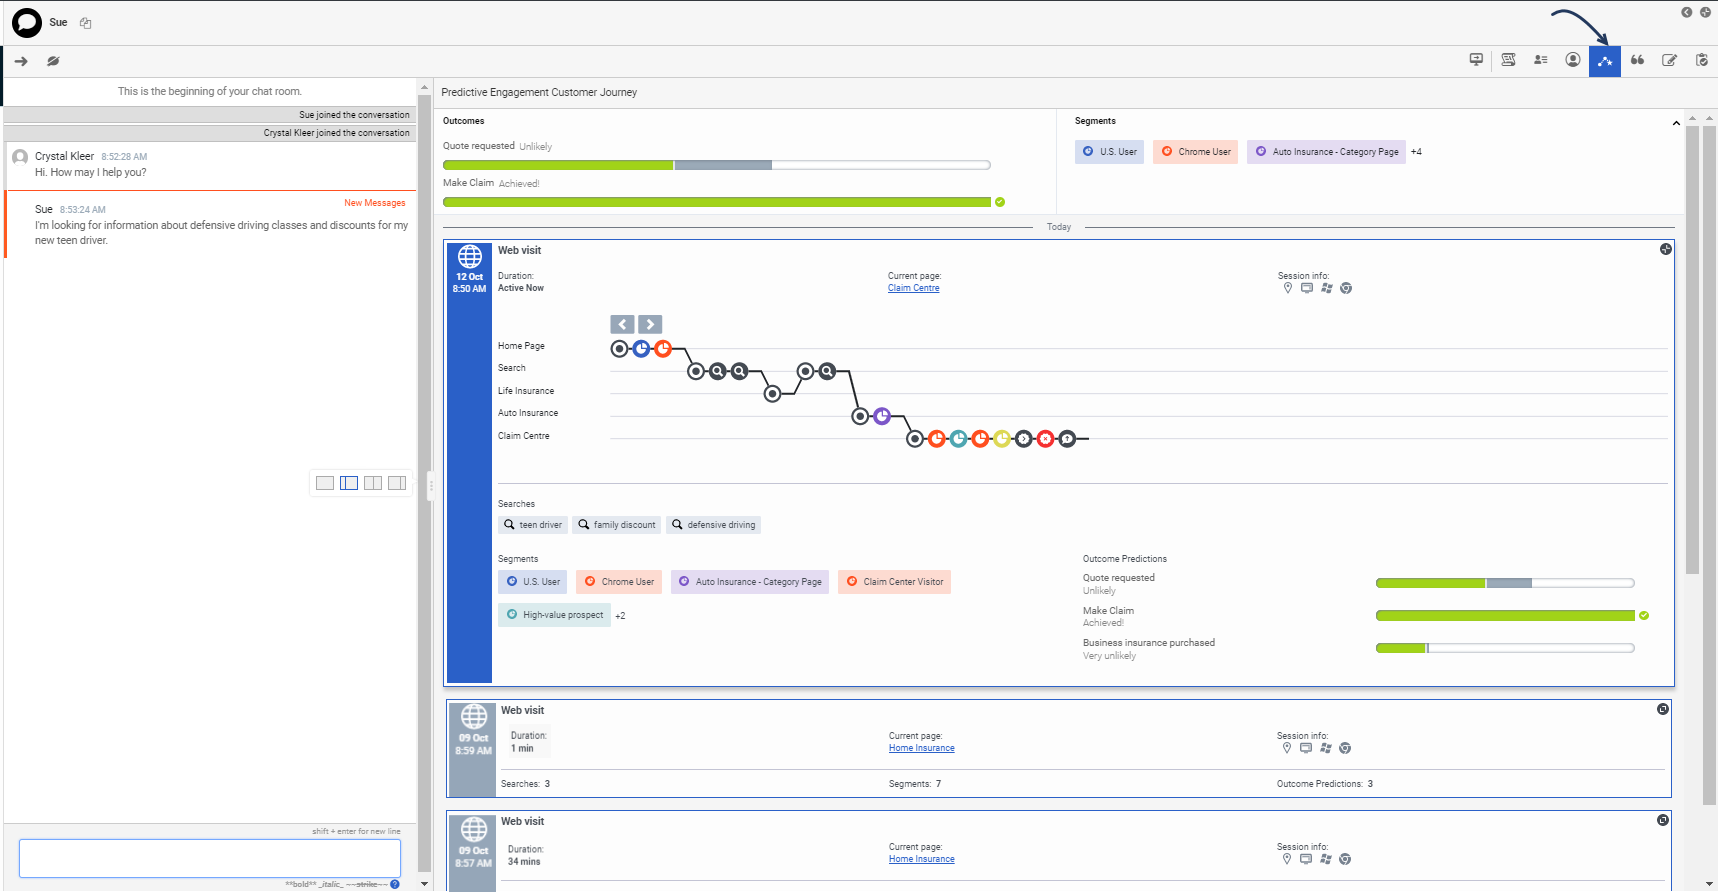
You see the full contextual history for a customer, on the Predictive Engagement Customer Journey tab in Genesys Cloud. Do the following things to improve your viewing experience:
- Switch to a half-size or full-size view of the tab.
- When you begin a phone-based interaction with a customer, remember to verify their external contact profile. After you do this, Genesys Predictive Engagement displays all of the contextual journey information we have for that customer.
Outcome predictions and segments matched
An outcome represents a particular goal and the colored bars represent the customer's progress toward that goal. For example, if the goal is to purchase a product, then the customer's progress moves toward that goal when the customer puts an item in their shopping cart. These bars update in real time as the customer's progress changes. For more information about outcomes, see About segments.
A segment represents a group of customers that have something in common. For example, a segment might include all customers who use the same browser or are from the same geographic region. Segments appear in the order in which Genesys Predictive Engagement assigns them to the customer. For more information about segments, see About outcome predictions and probabilities.Session cards
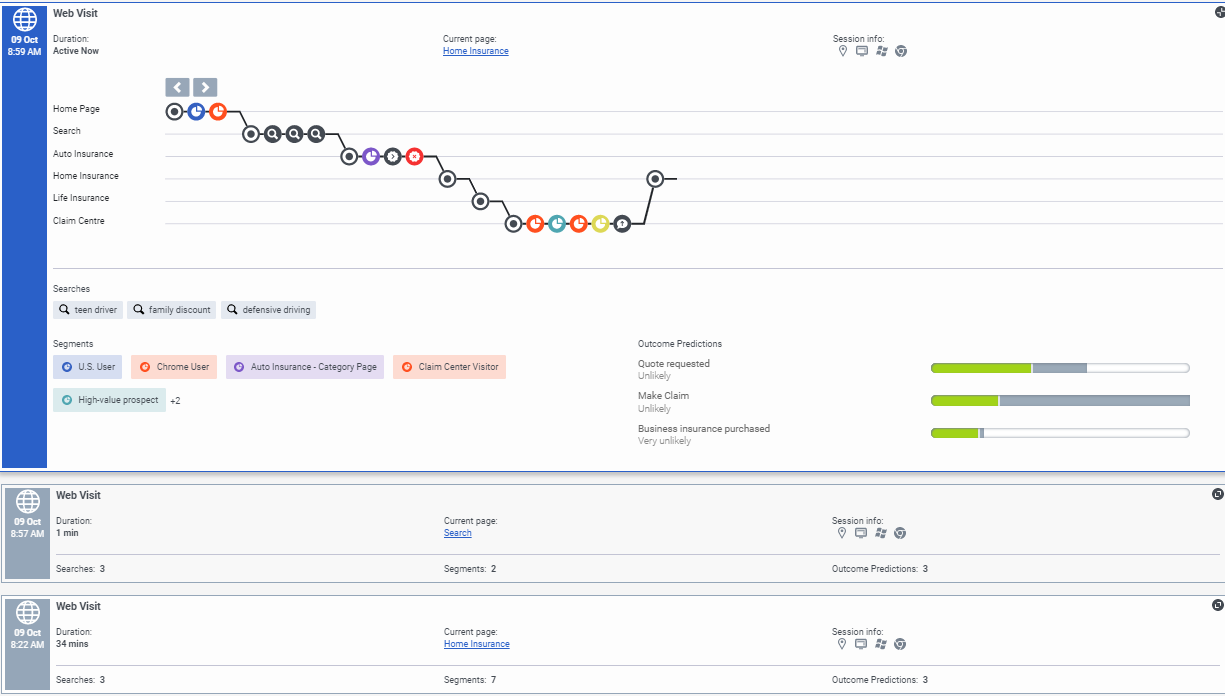
Session cards organize journey data so you can see both current and historical activity. Each card represents what the user did during a particular period of time called a session.
The newest session card appears at the top. If the session card is blue, it means that the customer is active on your website. After 20 minutes of inactivity, the card color changes to gray.- You may see more sessions if an email or phone number is provided after the current session begins because we try to match external contact records based on this data.
- We show data only about webpages we track. If a customer leaves your website and then comes back, we do not show you where the customer went.
Key card information includes:
- Journey map icons
- Session information icons
- Segments the customer matched
- Outcome progress during the session
View journey details
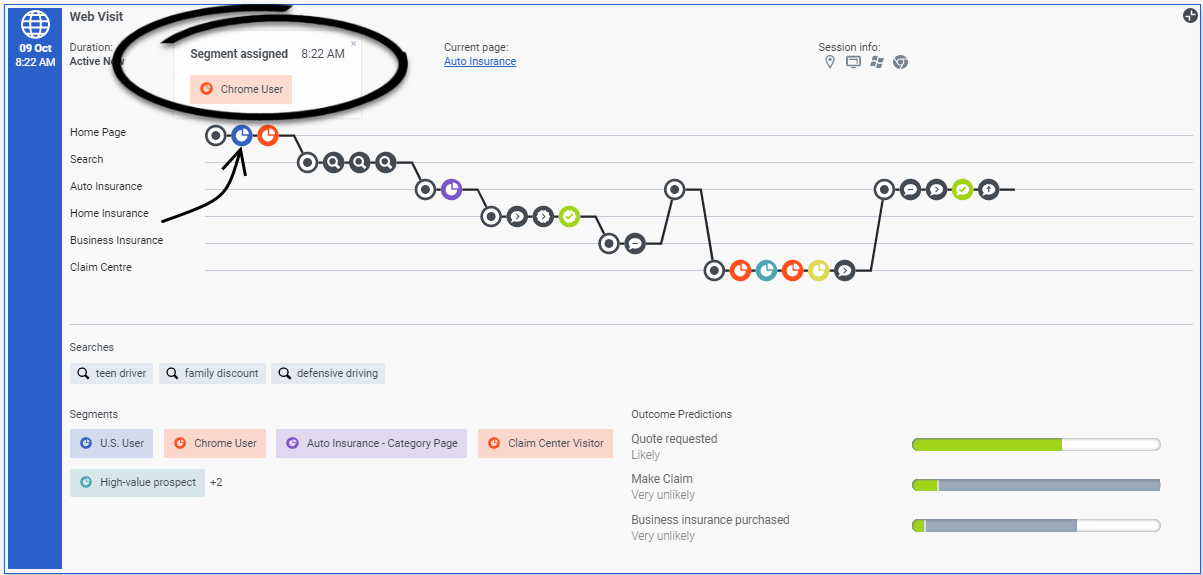
To see more details about a particular card, click it. In this view, you see the journey map.
The map updates in real time as the customer navigates your website, responds to interaction requests, and matches segments. To see the details of a particular icon on the map, click it. For more information about the icons, see Journey map icons.
- You can expand multiple cards simultaneously.
- The color of a segment matched icon corresponds to the color of the actual segment.
View searches performed
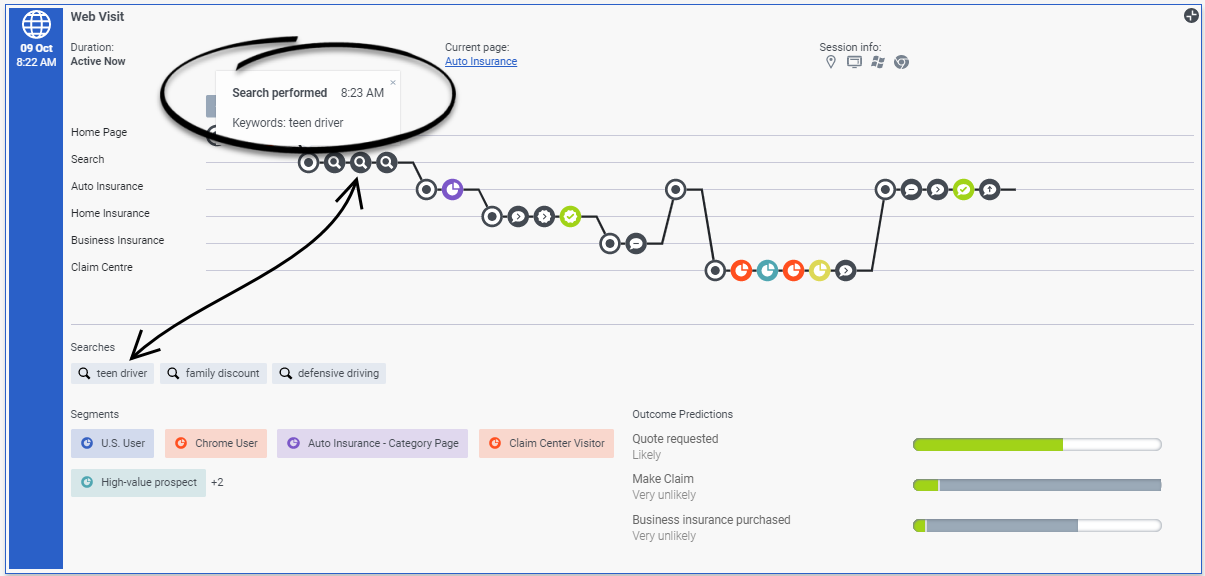
You can see what a customer has searched for during the session.
In the journey map, click a search icon to see what the customer searched for when.


